TireMaster Dashboard
This help topic is applicable to the following TireMaster applications:
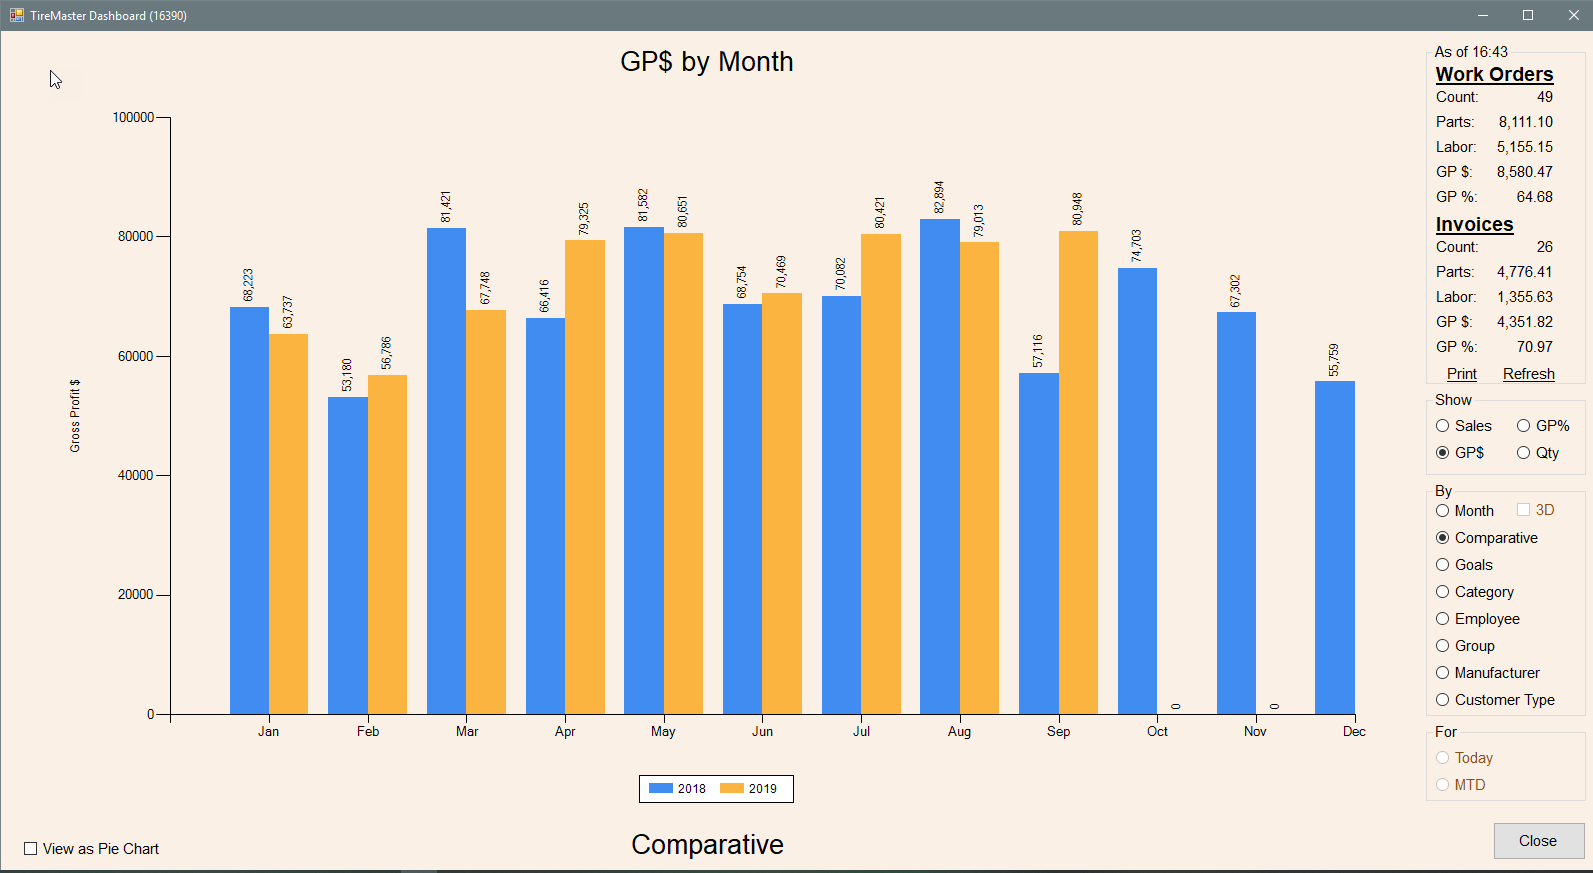
On-screen reporting of gross profit, sales, and quantity information is readily available on the TireMaster Dashboard.
Specifically, the Dashboard includes the following:
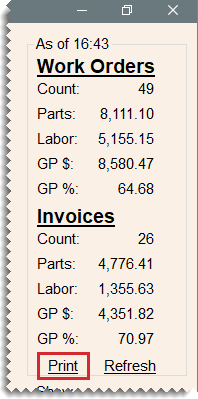
Gross profit dollar (GP$) and gross profit percentage (GP%) figures, parts and labor totals, and document counts for today’s work orders and invoices (upper-right corner of the screen).
Various options for generating on-screen graphs and pie-charts are listed below today’s information. These options include the ability to show daily or monthly GP$, GP%, sales totals, or quantities sold, organized by category, employee, group, manufacturer, or customer type.
The option to compare this year’s and last year’s GP$, GP%, sales, and quantity totals.
The option to set monthly sales and gross profit goals, so you can see whether you’re keeping pace with those objectives.
 Set Dashboard Reporting Goals
You can quickly assess your progress toward monthly business objectives by setting Dashboard reporting goals. When reporting goals are defined, the Dashboard includes sales and gross profit markers for gauging your success.
To set Dashboard reporting goals
|
1.
|
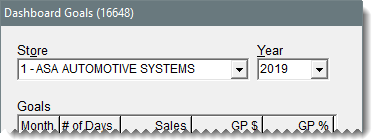
Select Setup > Dashboard Goals. The Dashboard Goals screen opens. |
|
2.
|
Select the store for which you want to set reporting goals (in TireMaster Corporate). |
|
3.
|
Select the year for which you want to set reporting goals. |
Note: If you’re prompted to save your changes before continuing, click Yes.
|
4.
|
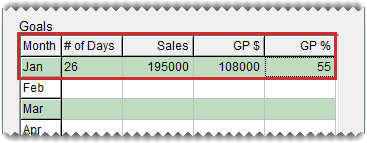
To set the goals for a month, do the following for that month. |
|
a.
|
Type the number of days the store is open. |
|
b.
|
Type the amount of money you want to earn in sales. |
|
c.
|
Type the gross profit you want to earn. |
|
d.
|
Type the gross profit percentage you want to earn. |
Note: An entry is needed in each of the fields for the month for which you’re setting goals. If you do not want to report on a dollar amount or percentage, type a 0.
|
5.
|
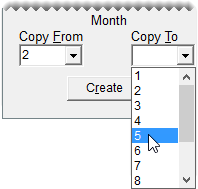
To use the goals from an existing month to set the goals for another month, copy the existing month’s goals and assign them to the other month. |
|
a.
|
Select the month with the goals you want to reuse from the Copy From drop-down. |
|
b.
|
Select the month that you want to assign the copied goals to from the Copy To drop-down. |
|
c.
|
Change the number of days, sales amount, GP$, and GP% if needed. |
|
6.
|
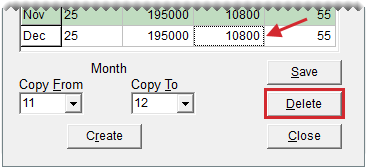
To delete the goals for a month, select one of the fields for that month and click Delete. |
|
7.
|
Click Save. A confirmation message appears. |
|
9.
|
Close the Dashboard Goals screen. |
 View the Dashboard
To open the Dashboard, press F9 on your computer’s keyboard. Access to the Dashboard is controlled with the permission Dashboard View.
To generate on-screen Dashboard graphics
|
1.
|
If the Dashboard is not already open, press F9. |
Note: When the Dashboard is already open, click

on the task bar.
|
2.
|
For a hard copy of the work order and invoice data (displayed in the upper-right corner), click Print. |
|
3.
|
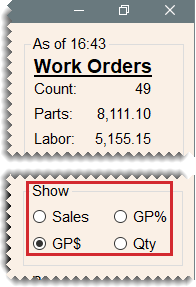
Under Show, define whether you want to generate sales, GP$, GP%, or quantity information. |
|
4.
|
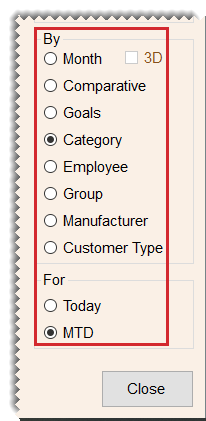
Under By, do the following as needed: |
Define whether you want to compare years, view the status of your goals, or organize the information by month, inventory category, employee, inventory group, manufacturer, or customer type.
Select the 3D check box if you want to generate a three-dimensional bar graph. For a one-dimensional bar graph, clear the check box.
Note: 3D is available only for reports generated by month.
|
5.
|
Under For, define whether to show today’s information or month-to-date (MTD) information. |
Note: These options are not available when the information is organized by month, when comparing two years, and viewing the status of goals.
|
6.
|
To generate a pie chart, select the View as Pie Chart check box (lower-left corner of the screen). |
|
7.
|
Do one of the following: |
If want to view additional information on the Dashboard, repeat steps 3 through 6.
If you want to exit the Dashboard, click Close.


