Close Tab Reports
This help topic is applicable to the following TireMaster applications:
|
TireMaster Point of Sale |
TireMaster Plus |
TireMaster Corporate |
|---|---|---|

|

|

|
The reports on the Close tab are useful for day end, month end, and year end closing activities. Some reports on this tab are also useful for accounting or payroll purposes.
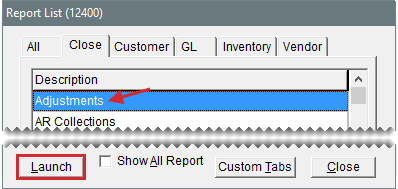
This report shows any items that were adjusted on an invoice during the selected date range. For each adjusted item, this report displays the invoice number, the item’s product code, quantity, parts price, labor price, federal excise tax, amount, cost, and gross profit margin percentage.
To generate the Adjustments Report
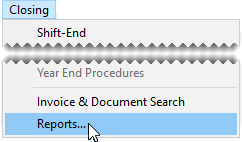
| 1. | Select Closing > Reports. The Report List opens with the Close tab selected. |
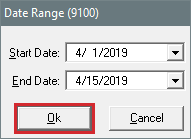
| 2. | Select Adjustments and click Launch. The Date Range screen opens. |
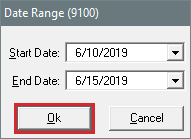
| 3. | Select the starting and ending dates for the report’s date range. |
| 4. | Click OK. The Report Window opens. |
| 5. | Print the report and close the Report Window. |
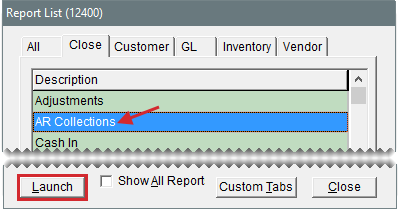
Referring to the AR Collections Report can help you collect money from customers who have outstanding balances. Depending on which customer lookup is used, information generated by this report can be grouped by customer, customer type, or salesperson. Balances displayed on the report can be aged by the date of the sale or by the payment due date.
To generate the AR Collections Report
| 1. | Select Closing > Reports. The Report List opens with the Close tab selected. |
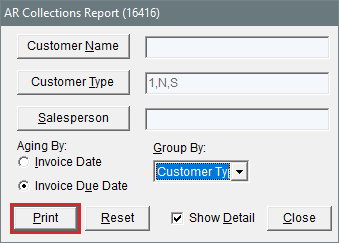
| 2. | Select AR Collections, and click Launch. The AR Collections Report screen opens. |
| 3. | To look up balances, do the following as needed: |
For all outstanding balances, leave the Customer Name, Customer Type, and Salesperson fields blank.
For a specific customer, click Customer Name and look up the customer. For more information, see Customer Searches.
For one or more customer types, click Customer Type. Then select one or more types and click OK.
For customers assigned to a specific salesperson, click Salesperson and select a name from the list that appears.
| 4. | Indicate how to age the balances by selecting either Invoice Date or Invoice Due Date. |
| 5. | Indicate how to organize information on the report by making a selection from the Group By drop‑down. |
| 6. | To include invoice information on the report, make sure the Show Detail check box is selected. For totals only, clear the check box. |
| 7. | Click Print. The Report Window opens. |
| 8. | Print the report and close the Report Window. |
| 9. | To generate a report for other customers, click Reset. Then repeat steps 3 through 8. |
| 10. | Close the AR Collections Report screen. |
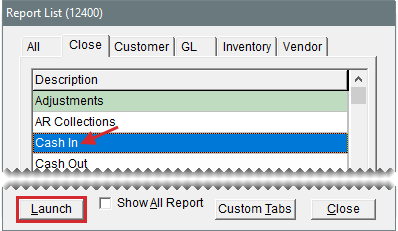
This report displays all of the cash collected during a date range, including invoices and amounts received on account (ROAs). It shows each invoice listed by transaction type and the method of payment.
To generate the Cash In Report
| 1. | Select Closing > Reports. The Report List opens with the Close tab selected. |
| 2. | Select Cash In and click Launch. The Date Range screen opens. |
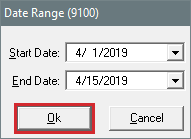
| 3. | Select the starting and ending dates for the report’s date range. |
| 4. | Click OK. The Report Window opens. |
| 5. | Print the report and close the Report Window. |
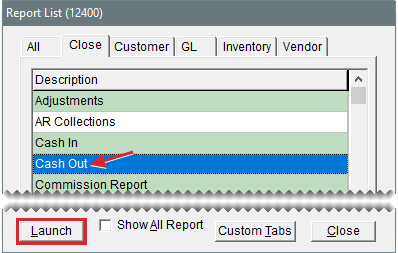
This report displays all of the cash paid out of the till for a selected date range.
To generate the Cash Out Report
| 1. | Select Closing > Reports. The Report List opens with the Close tab selected. |
| 2. | Select Cash Out and click Launch. The Date Range screen opens. |
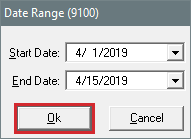
| 3. | Select the starting and ending dates for the report’s date range. |
| 4. | Click OK. The Report Window opens. |
| 5. | Print the report and close the Report Window. |
This report lists the major and minor accounts in your chart of accounts.
To generate a Chart of Accounts Listing
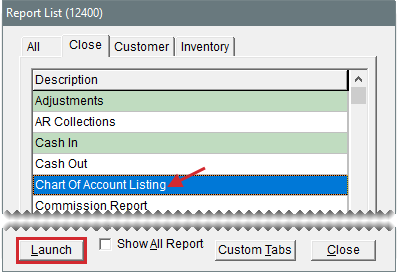
| 1. | Select Closing > Reports. The Report List opens with the Close tab selected. |
| 2. | Select Chart of Accounts Listing and click Launch. The Report Window opens. |
| 3. | Print the report and close the Report Window. |
This report displays the sales commissions and spiffs for an individual employee or all employees for a specific date range. The information included on the Commission report is described
|
Item |
Description |
|---|---|
|
CommType |
Identifies the type of commission that was used for a line: GM: Gross margin or gross profit (based on the report’s GP$ column) TS: Total sales or gross sales (based on the report’s TOTAL column) FD: Flat dollar amount (based on the report’s QTY column) S: Salesperson (from the work order’s SALES column) M1: Mechanic 1 (from the work order’s MECH1 column) M2: Mechanic 2 (from the work order’s MECH2 column) |
|
Qty |
Identifies the number of units for a line item. |
|
Total |
Identifies the total cost for a line item. |
|
GP$ |
Identifies the amount over your cost for an item. |
|
GPM% |
Identifies the markup percentage for an item. |
|
SpiffAmount |
Shows the calculated spiff for each item sold by an employee. |
|
CommAmount |
Shows the calculated commission for each item sold by or worked on by an employee. |
|
Split |
Defines whether the commission matrix code used for a line item is set up with a MECHANIC 2 rate (even if the job was not actually split). |
To generate a Commission Report
| 1. | Select Closing > Reports. The Report List opens with the Close tab selected. |
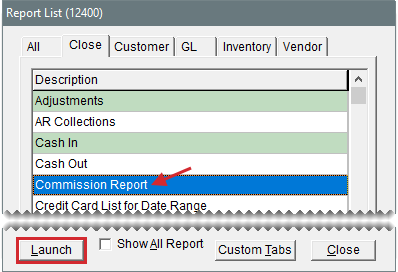
| 2. | Select Commission Report and click Launch. The Commission Report screen opens. |
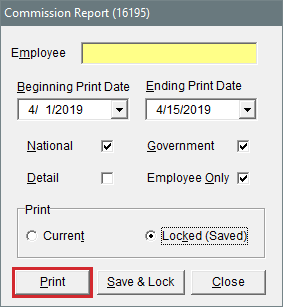
| 3. | Look up one or more employees: |
For one employee, click the Employee field and press  . Then select the employee’s name from the list that opens.
For all employees, leave the Employee field blank. Commission calculations can be saved and locked only when generating a report for all employees.
| 4. | Select a beginning and ending date for the report’s date range. |
| 5. | Define which information will appear on the report. |
| a. | To include national account and government support sales, select the National and Government check boxes as needed. |
| b. | To list the items sold, make sure the Detail check box is selected. For totals only, clear the check box. |
| c. | To exclude customer commission totals, select the Employee Only check box. |
| 6. | Define whether you want to generate information about locked or unlocked commissions: |
For unlocked commissions, select Current.
For locked commissions, selected Locked (Saved).
| 7. | Click Print. The Report Window opens. |
| 8. | Print the report and close the Report Window. |
Once you have verified that the commission calculations are accurate, you can prevent them from being changed by launching the report again and clicking Save & Lock.
This report lists all credit card purchases for a selected date range. It’s useful for reconciling payments from credit card companies.
To generate a Credit Card List for Date Range Report
| 1. | Select Closing > Reports. The Report List opens with the Close tab selected. |
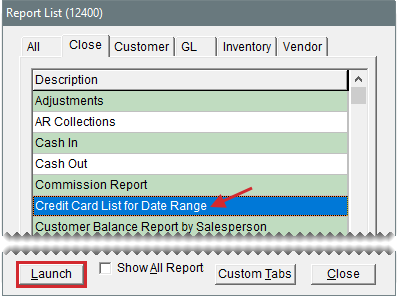
| 2. | Select Credit Card List for Date Range and click Launch. The Credit Card List for Date Range screen opens. |
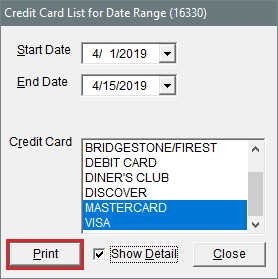
| 3. | Select the starting and ending dates for the report’s date range. |
| 4. | Select one or more credit cards. |
| 5. | To include invoice, credit card, and authorization numbers on the report, make sure the Show Detail check box is selected. For card totals only, clear the check box. |
| 6. | Click Print. The Report Window opens. |
| 7. | Print the report and close the Report Window. |
This report lists the aging balances for all of the customers that a salesperson is assigned to. You can generate the report for all salespeople, one salesperson, or a range of salespeople.
To generate a Customer Balance Report by Salesperson
| 1. | Select Closing > Reports. The Report List opens with the Close tab selected. |
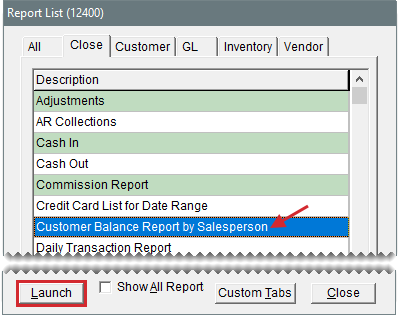
| 2. | Select Customer Balance Report by Salesperson and click Launch. The Customer Balance Report by Salesperson screen opens. |
| 3. | Select one or more salespeople: |
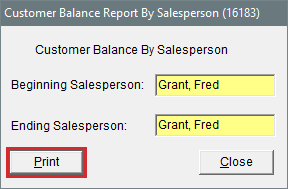
For one salesperson, press  in the Beginning Salesperson field and select an employee from the list that opens.
For a range of salespeople, press  in the Beginning Salesperson field and select an employee from the list that opens. Then click the Ending Salesperson field select another employee in the same manner.
For all salespeople, leave the Beginning Salesperson and Ending Salesperson fields as is.
| 4. | Click Print. The Report Window opens. |
| 5. | Print the report and close the Report Window. |
This report lists all transactions that occurred at point of sale during a selected date range. You can use this information to verify that the daily subledger totals match the account balances in general ledger.
To generate a Daily Transaction Report
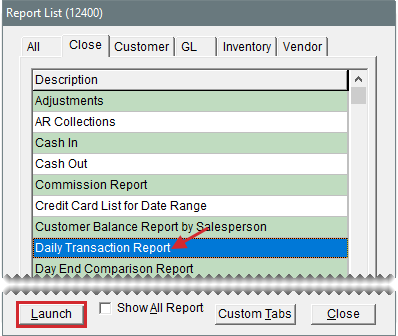
| 1. | Select Reports from the Closing menu. The Report List opens with the Close tab selected. |
| 2. | Select Daily Transaction Report and click Launch. The Date Range screen opens. |
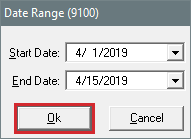
| 3. | Select the starting and ending dates for the report’s date range. |
| 4. | Click OK. The Report Window opens. |
| 5. | Print the report and close the Report Window. |
This report lets you generate information about year-to-date, month-to-date, and today’s sales activity. This information includes figures such as gross cost and net dollar margin.
To generate a Day End Comparison Report
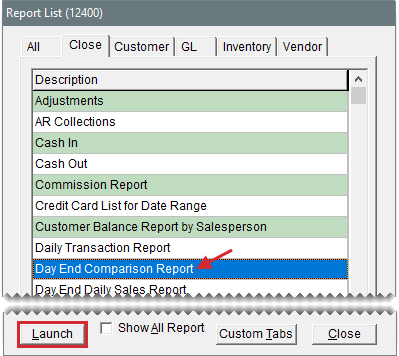
| 1. | Select Reports from the Closing menu. The Report List opens with the Close tab selected. |
| 2. | Select Day End Comparison Report and click Launch. The Day End Comparison Report screen opens. |
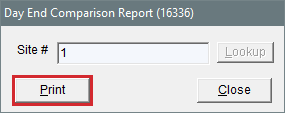
| 3. | Click Lookup |
| 4. | Click Print. The Report Window opens. |
| 5. | Print the report and close the Report Window. |
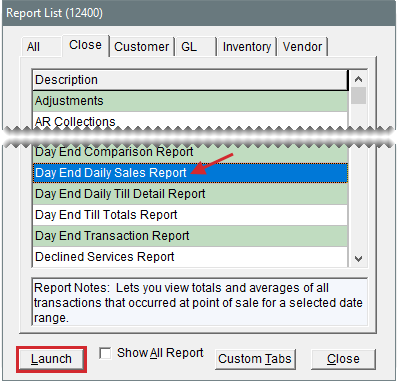
This report lets you view the totals and averages of all transactions that occurred at point of sale for a selected date range. This report is useful for determining your total sales and gross profit margin for a given period.
To generate a Day End Daily Sales Report
| 1. | Select Closing > Reports. The Report List opens with the Close tab selected. |
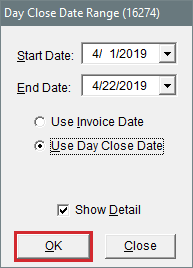
| 2. | Select Day End Daily Sales Report and click Launch. The Day Close Date Range screen opens. |
| 3. | Select the starting and ending dates for the report’s date range. |
| 4. | To retrieve documents that were completed on a specific day, select Use Invoice Date. For the documents included in the closing for a business day, select Use Day Close Date instead. |
| 5. | To organize information on the report by site, make sure Group by Site is selected. To combine the information instead, clear the check box |
| 6. | To include invoice information, select the Show Detail check box. For invoice totals and averages only, clear the check box. |
| 7. | Click OK. The Report Window opens. |
| 8. | Print the report and close the Report Window. |
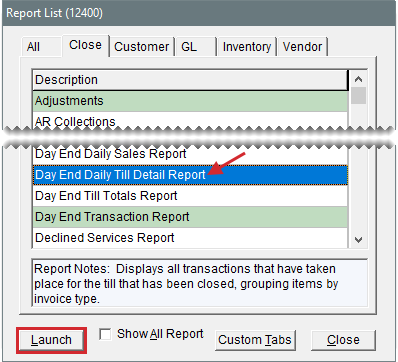
This report displays all transactions that have taken place for the till that has been closed, grouping items by invoice type. Like the Day End Daily Sales Report, it presents invoice totals but with different groupings.
To generate a Day End Daily Till Detail Report
| 1. | Select Closing > Reports. The Report List opens with the Close tab selected. |
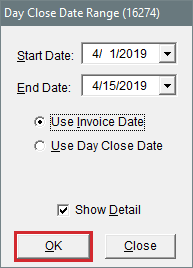
| 2. | Select Day End Daily Till Detail Report and click Launch. The Day Close Date Range screen opens. |
| 3. | Select the starting and ending dates for the report’s date range. |
| 4. | To retrieve documents that were completed on a specific day, select Use Invoice Date. For the documents included in the closing for a business day, select Use Day Close Date instead. |
| 5. | To include invoice information, select the Show Detail check box. For invoice totals and averages only, clear the check box. |
| 6. | Click OK. The Report Window opens. |
| 7. | Print the report and close the Report Window. |
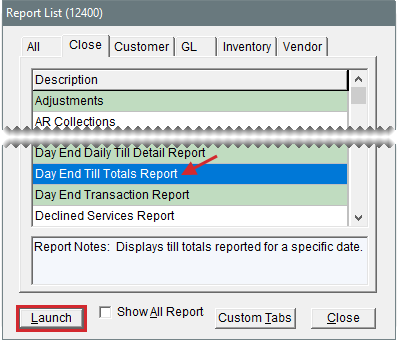
This report lists the till totals recorded for a specific date.
To generate a Day End Till Totals Report
| 1. | Select Closing > Reports. The Report List opens with the Close tab selected. |
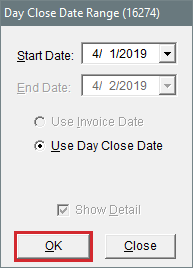
| 2. | Select Day End Till Totals Report, and click Launch. The Day Close Date Range screen opens. |
| 3. | Enter the date for which you want a list of till totals in the Start Date field. |
| 4. | Click OK. The Report Window opens. |
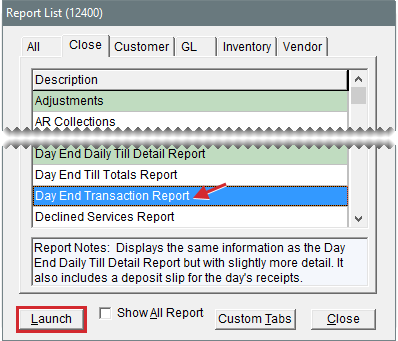
This report displays the same information as the Day End Daily Till Detail Report (all transactions for the till that has been closed) but with slightly more detail. It also includes a deposit slip for the day’s receipts.
To generate a Day End Transaction Report
| 1. | Select Closing > Reports. The Report List opens with the Close tab selected. |
| 2. | Select Day End Transaction Report and click Launch. The Day Close Date Range screen opens. |
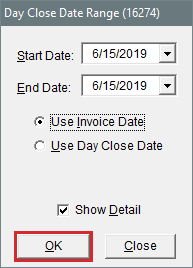
| 3. | Select the starting and ending dates for the report’s date range. For a single day, use the same date for both the starting and ending dates. |
| 4. | Do one of the following: |
For transactions completed on a specific day, select Use Invoice Date.
For transactions included in the closing process run for a business day (or a range of business days), select Use Day Close Date.
| 5. | To include invoice information, select the Show Detail check box. For invoice totals and averages only, clear the check box. |
| 6. | Click OK. The Report Window opens. |
| 7. | Print the report and close the Report Window. |
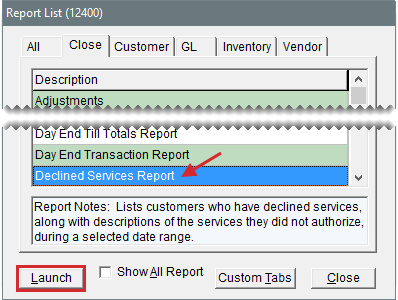
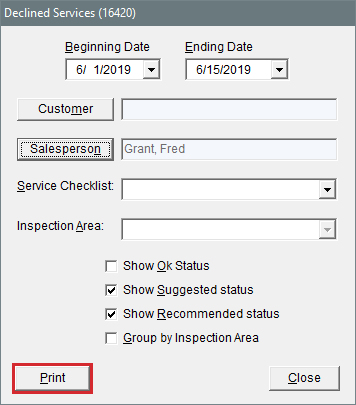
This report lists customers who’ve declined services, along with descriptions of the services they did not authorize, during a selected date range. You can generate the report for all customers, a single customer, or by salesperson. When generating the report for all customers or by salesperson, you also have the option to limit the information retrieved to a single checklist and inspection area.
To generate a Declined Services Report
| 1. | Select Closing > Reports. The Report List opens with the Close tab selected. |
| 2. | Select Declined Services Report, and click Launch. The Declined Services screen opens. |
| 3. | Select the starting and ending dates for the report’s date range. |
| 4. | To retrieve information for a specific customer, click Customer and look up the customer. Otherwise, leave this field empty. |
| 5. | To retrieve information for a specific salesperson, click Salesperson and make a selection from the list that opens. Otherwise, leave this field empty. |
| 6. | To retrieve information for a specific checklist and inspection area, select the name of the checklist from the Service Checklist drop-down. Then make a selection from the Inspection Area drop-down. You can disregard the numbers listed to the right of the service checklist and inspection area names. |
| 7. | Select or clear the check boxes to define whether services should be included based on the condition of inspection areas. |
| 8. | To organize the report by inspection area, select the Group by Inspection Area check box. Otherwise, leave the check box alone. |
| 9. | Click Print.The Report Window opens. |
| 10. | Print the report and close the Report Window. |
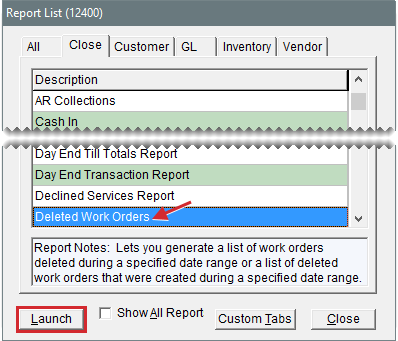
With this report, you can generate one of the following:
A list of work orders deleted during a specific date range
A list of deleted work orders that were created during a specific date range
For each deleted work order, the report includes item quantity, cost, and price information. It also displays the name of the user who started and deleted each work order
When the System Control Work Orders - Require Comments When Deleting is set to Yes, the report also includes the reasons for deleting work orders.
To generate a Deleted Work Orders Report
| 1. | Select Closing > Reports. The Report List opens with the Close tab selected. |
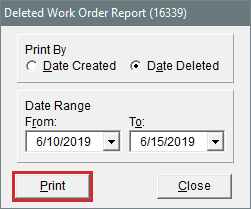
| 2. | Select Deleted Work Orders and click Launch. The Deleted Work Order Report screen opens. |
| 3. | Select one of the following options: |
For a list of deleted work orders created during a specific date range, select Date Created.
For a list of work orders deleted during a specific date range, select Date Deleted instead.
| 4. | Select the starting and ending dates for the report’s date range. |
| 5. | Click Print. The Report Window opens. |
| 6. | Print the report and close the Report Window. |
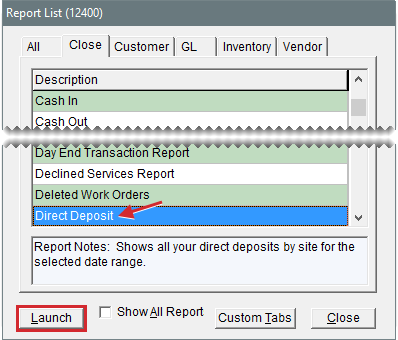
This report shows all your direct deposits for the selected date range.
To generate a Direct Deposit Report
| 1. | Select Closing > Reports. The Report List opens with the Close tab selected. |
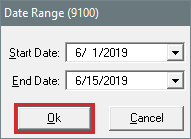
| 2. | Select Direct Deposit and click Launch. The Date Range screen opens. |
| 3. | Select the starting and ending dates for the report’s date range. |
| 4. | Click OK. The Report Window opens. |
| 5. | Print the report and close the Report Window. |
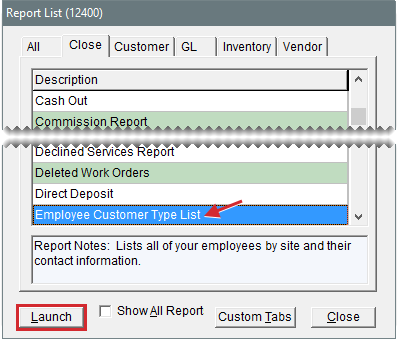
This report lists all of your employees and their contact information.
To generate an Employee Customer Type List
| 1. | Select Closing > Reports. The Report List opens with the Close tab selected. |
| 2. | Select Employee Customer Type List and click Launch. The Report Window opens. |
| 3. | Print the report and close the Report Window. |
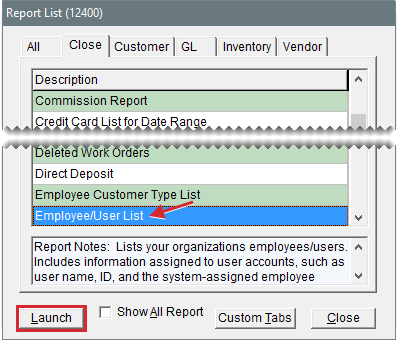
This report lists the employees/users set up in TireMaster. It includes information assigned to user accounts, such as user name, ID, and the system-assigned employee number. This report can be generated for all employees/users or only those who are active.
To generate an Employee/User List
| 1. | Select Reports from the Closing menu. The Report List opens with the Close tab selected. |
| 2. | Select Employee/User List and click Launch. The Employee/User List screen opens. |
| 3. | To limit the report to active employees/users, make sure the Show Active Only check box is selected. For both active and inactive employees/users, clear the check box. |
| 4. | Click Print. The Report Window opens. |
| 5. | Print the report and close the Report Window. |
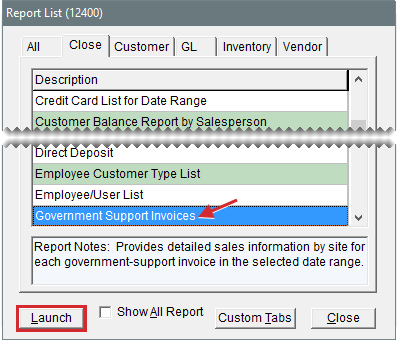
This report provides detailed sales information for each government support invoice generated during the selected date range.
To generate a Government Support Invoices Report
| 1. | Select Closing > Reports. The Report List opens with the Close tab selected. |
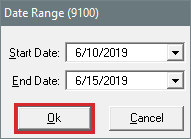
| 2. | Select Government Support Invoices and click Launch. The Date Range screen opens. |
| 3. | Select the starting and ending dates for the report’s date range. |
| 4. | Click OK. The Report Window opens. |
| 5. | Print the report and close the Report Window. |
This report is no longer used.
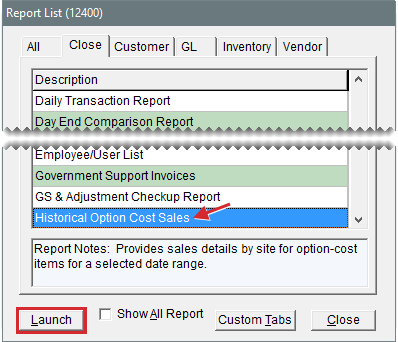
This report provides sales details for option cost items for a selected date range.
To generate a Historical Option Cost Sales Report
| 1. | Select Closing > Reports. The Report List opens with the Close tab selected. |
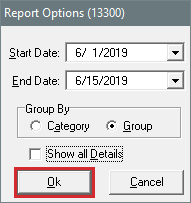
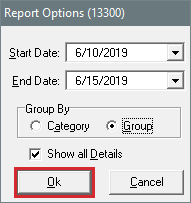
| 2. | Select Historical Option Cost Sales and click Launch. The Report Options screen opens. |
| 3. | Select the starting and ending dates for the report’s date range. |
| 4. | Select one of the following methods for organizing items on the report: |
Category
Group
| 5. | To include invoice information on the report, make sure the Show all Details check box is selected. For totals only, clear the check box. |
| 6. | Click OK. The Report Window opens. |
| 7. | Print the report and close the Report Window. |
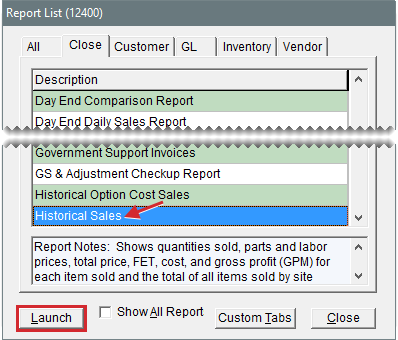
This report shows quantities sold, parts and labor prices, total price, FET, cost, and gross profit (GPM) for each item sold and the total of all items sold during a selected date range. This report is useful for month end closing procedures.
To generate a Historical Sales Report
| 1. | Select Closing > Reports. The Report List opens with the Close tab selected. |
| 2. | Select Historical Sales and click Launch. The Report Option screen opens. |
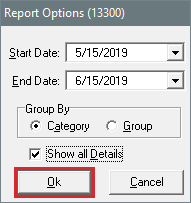
| 3. | Select the starting and ending dates for the report’s date range. |
| 4. | Select one of the following methods for organizing items on the report: |
Category
Group
| 5. | To include invoice information on the report, make sure the Show All Details check box is selected. For totals only, clear the check box. |
| 6. | Click OK. The Report Window opens. |
| 7. | Print the report and close the Report Window. |
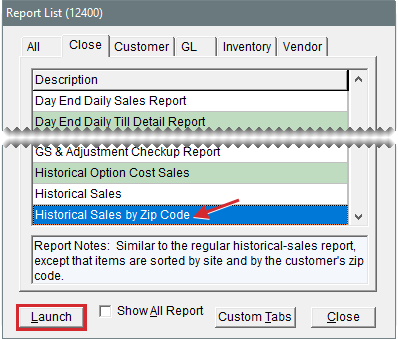
This report is similar to the regular historical sales report, except that items are sorted
To generate a Historical Sales by Zip Code Report
| 1. | Select Closing > Reports. The Report List opens with the Close tab selected. |
| 2. | Select Historical Sales by Zip Code and click Launch. The Report Options screen opens. |
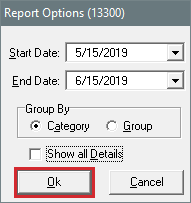
| 3. | Select the starting and ending dates for the report’s date range. |
| 4. | Select one of the following methods for organizing items on the report: |
Category
Group
| 5. | To include invoice information on the report, make sure the Show All Details check box is selected. For totals only, clear the check box. |
| 6. | Click OK. The Report Window opens. |
| 7. | Print the report and close the Report Window. |
You can use this report to see if your invoice and gross profit averages increased as the result of selling a particular item, such as a coupon discount, during a specified date range. You can include information for all customers or a single customer on the report.
To generate an Invoice Averages by Date Report
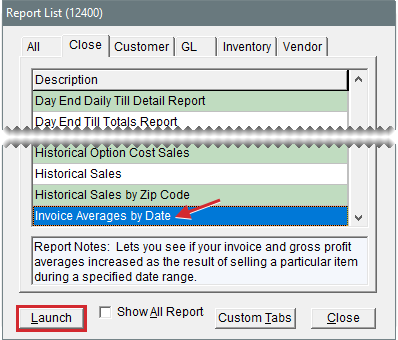
| 1. | Select Closing > Reports. The Report List opens with the Close tab selected. |
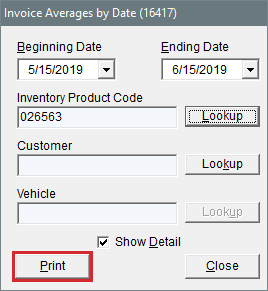
| 2. | Select Invoice Averages by Date and click Launch. The Invoice Averages by Date screen opens. |
| 3. | Select the starting and ending dates for the report’s date range. |
| 4. | Click the Lookup button next to the Inventory Product Code field, and search for the item on which you want to base the report. For more information, see Inventory Searches. |
| 5. | Define how much customer information you want to include on the report: |
For all customers, leave the Customer and Vehicle fields blank.
For a single customer, click the Lookup button next to the Customer field and look up the customer. To retrieve information about a specific vehicle owned by the customer, also click the Lookup button next to the Vehicle field and select the vehicle. For more information, see Customer Searches.
| 6. | To include individual invoice totals, leave the Show Detail check box selected. For a summary of the invoice averages, clear the check box. |
| 7. | Click Print. The Report Window opens. |
| 8. | Print the report and close the Report Window. |
This report shows the detail for each invoice by customer during the selected date range. It can be generated any time or as a daily or weekly report.
To generate an Invoice Detail Report
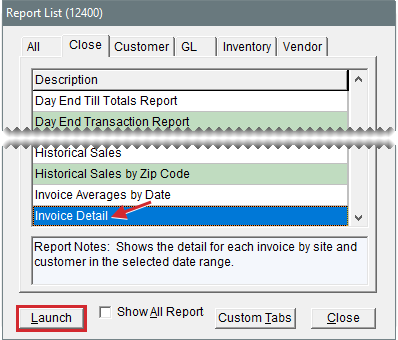
| 1. | Select Closing > Reports. The Report List opens with the Close tab selected. |
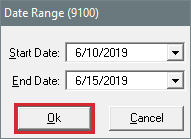
| 2. | Select Invoice Detail and click Launch. The Date Range screen opens. |
| 3. | Select the starting and ending dates for the report’s date range. |
| 4. | Click OK. The Report Window opens. |
| 5. | Print the report and close the Report Window. |
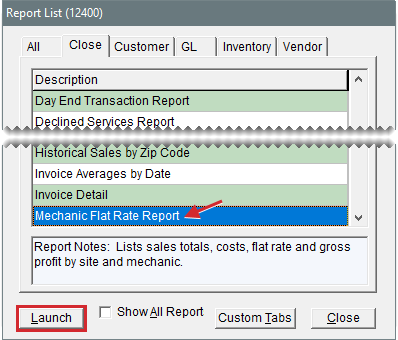
This report lists the number of hours of work produced by a single mechanic or all of your mechanics. The number of hours worked is displayed in the flat rate column. For more information, see Calculate Mechanic Productivity.
To generate a Mechanic Flat Rate Report
| 1. | Select Closing > Reports. The Report List opens with the Close tab selected. |
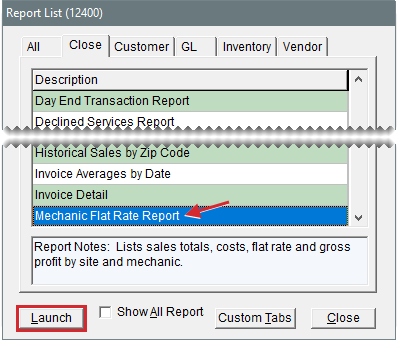
| 2. | Select Mechanic Flat Rate Report and click Launch. |
| 3. | Select the starting and ending dates for the report’s date range. |
| 4. | To generate the report for all employees, leave the Employee field blank. For a single employee, click the Employee field, press  , and select a name from the list that appears. , and select a name from the list that appears. |
| 5. | Select one of the following methods for organizing items on the report: |
Category
Group
Invoice
| 6. | To print information for each mechanic on a separate page, make sure the Page Break check box is selected. For one continuous document, clear the check box. |
| 7. | To include the time spent on each job, make sure the Show All Details check box is selected. For subtotals only, clear the check box. |
| 8. | To exclude gross profit percentages, select the Suppress profit information check box. To include the information, clear the check box. |
| 9. | Click OK. The Report Window opens. |
| 10. | Print the report and close the Report Window. |
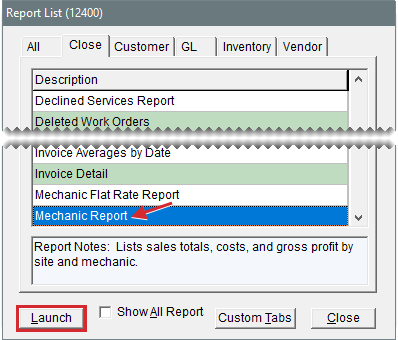
This report lists sales totals, costs, and gross profit by mechanic. It can be generated at the end of the month to help you determine commission amounts for mechanics.
To generate a Mechanic Report
| 1. | Select Closing > Reports. The Report List opens with the Close tab selected. |
| 2. | Select Mechanic Report and click Launch. The Report Options screen opens. |
| 3. | Select the starting and ending dates for the report’s date range. |
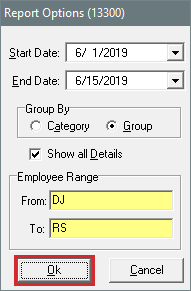
| 4. | Select one of the following methods for organizing items on the report: |
Category
Group
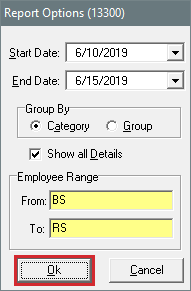
| 5. | To include information about each item sold, make sure the Show All Details check box is selected. For category or group subtotals, clear the check box. |
| 6. | Do one of the following in the Employee Range area: |
For all mechanics, leave the From and To fields blank.
For a range of mechanics, select the employees for the beginning (From field) and end (To field) of the range. To select an employee, click a field and press  . Then choose a name from the list that appears.
For a single mechanic, click the From field and press  . Then choose a name from the list that appears.
| 7. | Click OK. The Report Window opens. |
| 8. | Print the report and close the Report Window. |
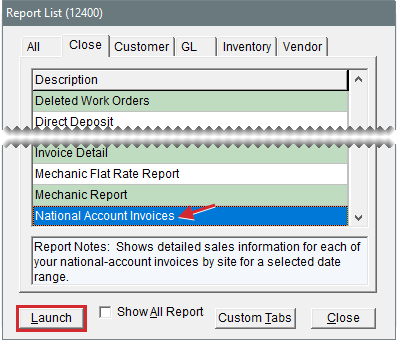
This report shows detailed sales information for each of your national account invoices for a selected date range.
To generate a National Account Invoices Report
| 1. | Select Closing > Reports. The Report List opens with the Close tab selected. |
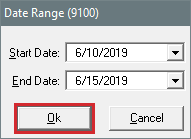
| 2. | Select National Account Invoices and click Launch. The Date Range screen opens. |
| 3. | Select the starting and ending dates for the report’s date range. |
| 4. | Click OK. The Report Window opens. |
| 5. | Print the report and close the Report Window. |
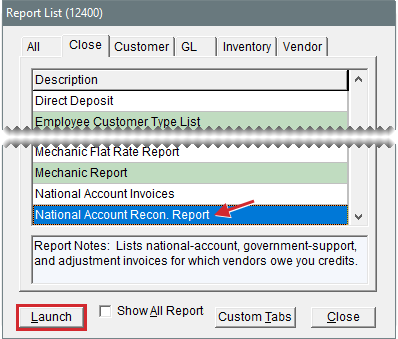
This report lists national account, government support, and adjustment invoices for which vendors owe you credits. When this report is generated from the Report List, it shows the totals for each reconciliation code for a specified date range.
To generate a National Account Recon Report
| 1. | Select Closing > Reports. The Report List opens with the Close tab selected. |
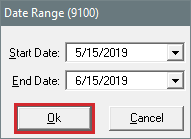
| 2. | Select National Account Recon. Report and click Launch. The Date Range screen opens. |
| 3. | Select the starting and ending dates for the report’s date range. |
| 4. | Click OK. The Report Window opens. |
| 5. | Print the report and close the Report Window. |
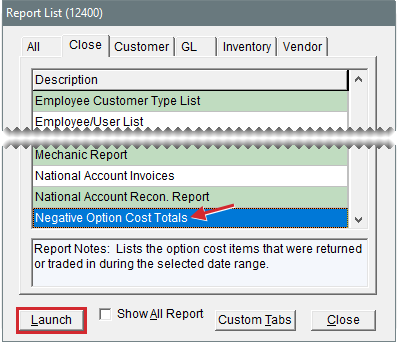
This report lists the option cost (outside purchase) items that were returned or traded in during the selected date range. It shows the cost (including FET) that posted to the inventory and cost of goods sold accounts.
To generate a Negative Option Cost Totals Report
| 1. | Select Closing > Reports. The Report List opens with the Close tab selected. |
| 2. | Select Negative Option Cost Totals and click Launch. The Date Range screen opens. |
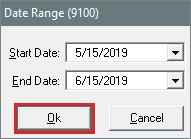
| 3. | Select the starting and ending dates for the report’s date range. |
| 4. | Click OK. The Report Window opens. |
| 5. | Print the report and close the Report Window. |
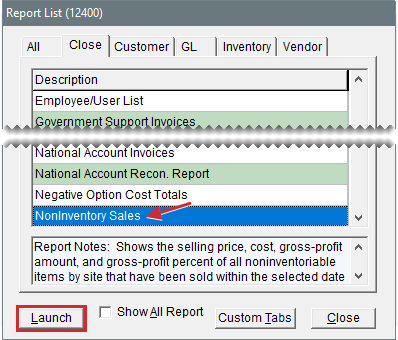
This report shows the selling price, cost, gross profit amount, and gross profit percent of all noninventoriable items that have been sold within the selected date range.
To generate a Noninventory Sales Report
| 1. | Select Closing > Reports. The Report List opens with the Close tab selected. |
| 2. | Select Noninventory Sales and click Launch. The Date Range screen opens. |
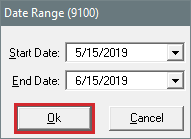
| 3. | Select the starting and ending dates for the report’s date range. |
| 4. | Click OK. The Report Window opens. |
| 5. | Print the report and close the Report Window. |
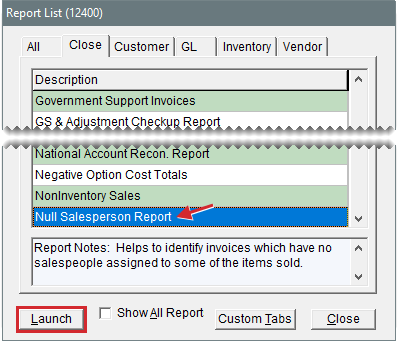
This report helps users identify invoices that have no salespeople assigned to some of the items sold.
To generate a Null Salesperson Report
| 1. | Select Closing > Reports. The Report List opens with the Close tab selected. |
| 2. | Select Null Salesperson Report and click Launch. The Report Window opens. |
| 3. | Print the report and close the Report Window. |
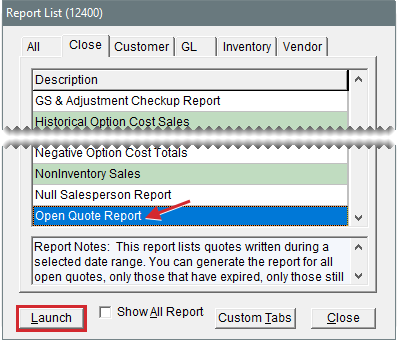
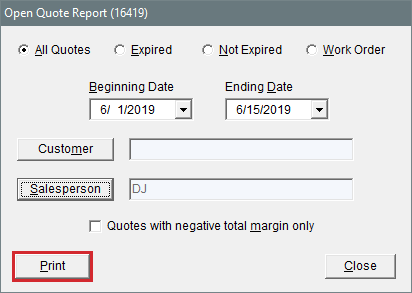
This report lists quotes written during a selected date range. You can generate the report for all quotes, only those that have expired, only those still in effect, or only those that have been turned into work orders. You can also limit information retrieved by the report to a particular customer, salesperson, or quotes whose total margin was negative.
To generate an Open Quote Report
| 1. | Select Closing > Reports. The Report List opens with the Close tab selected. |
| 2. | Select Open Quote Report, and click Launch. The Open Quote Report screen opens. |
| 3. | Depending on which quotes you want to include, select All Quotes, Expired, Not Expired, or Work Order. |
| 4. | Select the starting and ending dates for the date range in which the quotes were written. |
| 5. | Do one of the following: |
For all quotes, leave the Customer and Salesperson fields blank.
For quotes for a single customer, click Customer and look up the customer. For more information, see Customer Searches.
For quotes assigned to a single salesperson, click Salesperson and select the employee’s name from the list that opens.
| 6. | To display only those quotes whose total margin is negative, select the Quotes with negative total margin only check box. |
| 7. | Click Print. The Report Window opens. |
| 8. | To print the report, click Print. Then click Close. |
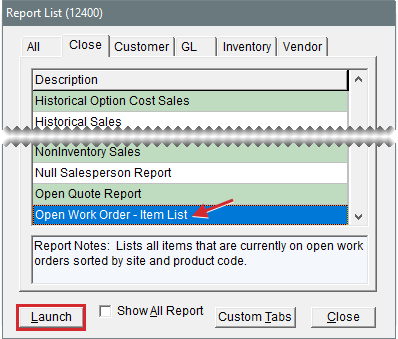
This report lists all items that are currently on open work orders sorted by product code.
To generate an Open Work Order - Item List
| 1. | Select Closing > Reports. The Report List opens with the Close tab selected. |
| 2. | Select Open Work Order - Item List and click Launch. The Report Window opens. |
| 3. | Print the report and close the Report Window. |
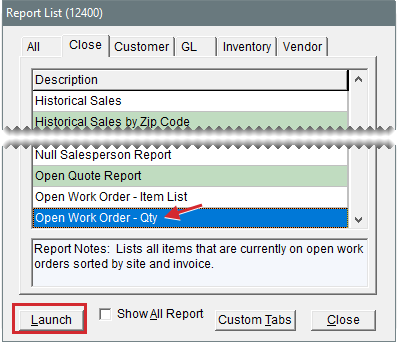
This report lists all items that are currently on open work orders sorted by invoice.
To generate an Open Work Order - Qty Report
| 1. | Select Closing > Reports. The Report List opens with the Close tab selected. |
| 2. | Select Open Work Order - Qty and click Launch. The Report Window opens. |
| 3. | Print the report and close the Report Window. |
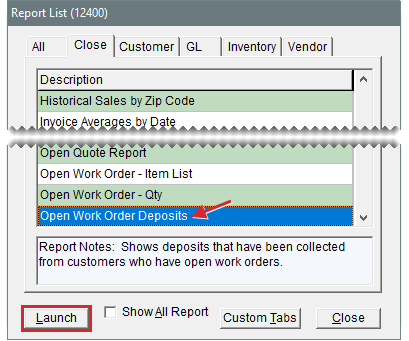
This report shows deposits that have been collected from customers who have open work orders. The deposit total for this report should match the balance of the clearing account for tracking point of sale deposits.
To generate the Open Work Order Deposits Report
| 1. | Select Closing > Reports. The Report List opens with the Close tab selected. |
| 2. | Select Open Work Order Deposits and click Launch. The Open Work Order Deposits screen opens. |
| 3. | To include invoice and customer contact information on the report, select the Show Detail check box. For customer deposit totals only, clear the Show Detail check box. |
| 4. | Click Print. The Report Window opens. |
| 5. | Print the report and close the Report Window. |
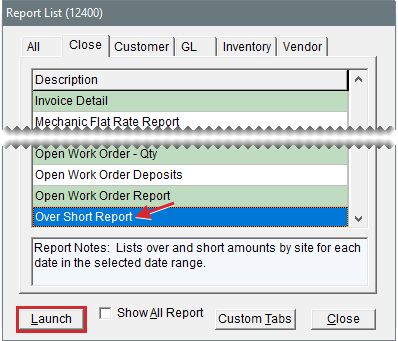
This report lists over and short amounts for each date in the selected date range.
To generate an Over Short Report
| 1. | Select Closing > Reports. The Report List opens with the Close tab selected. |
| 2. | Select Over Short Report and click Launch. The Date Range screen opens. |
| 3. | Select the starting and ending dates for the report’s date range. |
| 4. | Click OK. The Report Window opens. |
| 5. | Print the report and close the Report Window. |
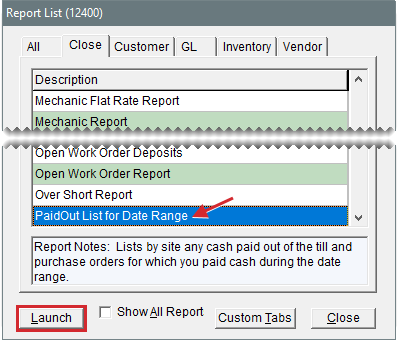
This report lists paidouts and purchase orders that you paid cash for during the selected date range.
To generate a Paid List for Date Range Report
| 1. | Select Closing > Reports. The Report List opens with the Close tab selected. |
| 2. | Select Paidout List for Date Range and click Launch. The Date Range screen opens. |
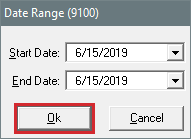
| 3. | Select the starting and ending dates for the report’s date range. |
| 4. | Click OK. The Report Window opens. |
| 5. | Print the report and close the Report Window. |
This report is one of two reports used by Support to resolve posting errors. You should generate this report as part of the month end closing process and if you receive a message about posting errors when logging in to TireMaster.
To generate a Post Error Report
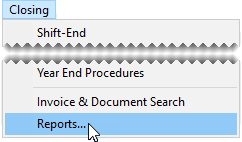
| 1. | Select Closing > Reports. The Report List opens with the Close tab selected. |
| 2. | Select Post Error Report and click Launch. The Report Window opens. |
| 3. | Print the report and close the Report Window. |
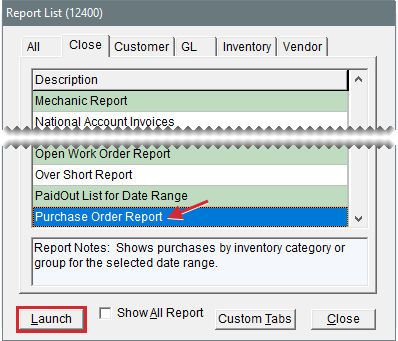
This report shows purchases by inventory category or group for the selected date range.
To generate a Purchase Order Report
| 1. | Select Closing > Reports. The Report List opens with the Close tab selected. |
| 2. | Select Purchase Order Report and click Launch. The Report Options screen opens. |
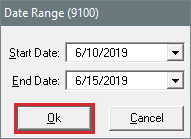
| 3. | Select the starting and ending dates for the report’s date range. |
| 4. | Select one of the following methods for organizing items on the report: |
Group
Category
| 5. | To include information for each item ordered, make sure the Show All Details check box is selected. For totals only, clear the check box. |
| 6. | Click OK. The Report Window opens. |
| 7. | Print the report and close the Report Window. |
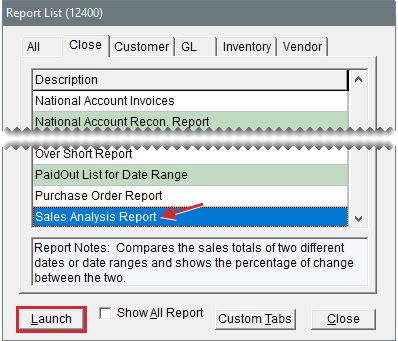
This report compares the sales totals of two different dates or date ranges and shows the percentage of change between the two. It provides several different settings for retrieving information, and the first page of the report shows which settings were chosen. Because your selections are saved until you exit the report settings screen, you can go back and modify them after printing.
To generate a Sales Analysis Report
| 1. | Select Closing > Reports. The Report List opens with the Close tab selected. |
| 2. | Select Sales Analysis Report and click Launch. The Sales Analysis Report Options screen opens. |
| 3. | Select one of the following report types: |
Store to generate storewide sales figures
Salesperson to generate sales figures by salesperson
| 4. | Select one of the following methods for organizing items on the report: |
Category
Group
Neither
| 5. | Select one of the following in the Sort By area: |
Units to display items from the highest to the lowest number of units sold
Dollars to display items from the highest to lowest dollar amount sold
| 6. | To include items sold on the report, make sure the Show Detail check box is selected. For totals only, clear the check box. |
| 7. | Choose the following date ranges. |
| a. | Select a date or date range from the Report Date Range pop-up calendars. |
| b. | Select another date or date range from the Compare Date Range pop‑up calendars. |
| 8. | Define whether to display the sales figures in report subgroups: |
If you selected the store report type (step 3), select Salesperson or Customer. Then, look up one salesperson, a range of salespeople, all salespeople, one customer, or all customers.
 and select an employee or customer from the list that opens. For all salespeople or customers, leave the fields blank.
If you selected the salesperson report type (step 3), look up one salesperson, a range of salespeople, or all salespeople. Then limit the report to one customer or include all customers.
If you don’t want to display the information subgroups, select Suppress Salesperson/Customer Grouping.
| 9. | Click Print. The Report Window opens. |
| 10. | Print the report and close the Report Window. |
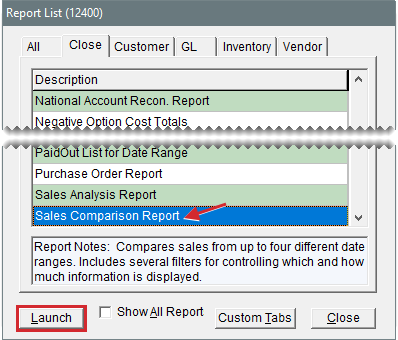
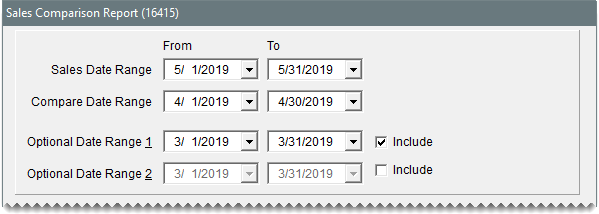
With the Sales Comparison Report, you can compare sales that occurred in up to four different date ranges. These date ranges can be selected at random or they can be a series of weeks, months, quarters, or years. You can also generate the report for specific sites.
To generate a Sales Comparison Report
| 1. | Select Closing > Reports. The Report List opens with the Close tab selected. |
| 2. | Select Sales Comparison Report and click Launch. The Sales Comparison Report screen opens. |
| 3. | Select the date ranges you want to compare from the pop-up calendars. To compare three date ranges, select the Include check box for Optional Date Range 1. For four date ranges, select the Include check boxes for both Optional Date Range 1 and Optional Date Range 2. |
| 4. | Choose which customers you want to include on the report by doing the following as needed: |
For a single customer, click Customer Name and look up the customer. For more information, see Customer Searches.
For one or more customer types, click Customer Type. Then select one or more types from the list that opens.
For customers assigned to a specific salesperson, click Salesperson and select a name from the list that opens.
For all customers, leave the Customer Name, Customer Type, Salesperson, and Sites (in TireMaster Corporate) fields blank.
| 5. | Choose which items you want to include on the report by doing one of the following: |
For a single item or a group of items, click Inventory and look up the item or items. For more information, see Inventory Searches.
For all items, disregard looking up any inventory.
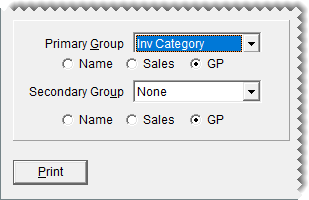
| 6. | To organize items retrieved by the report, do the following. |
| a. | Select the main method of grouping the items from the Primary Group drop-down. |
| b. | Select an additional grouping method from the Secondary Group drop-down if needed. |
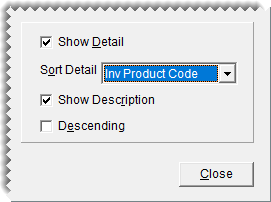
| 7. | Set the display options for the report. |
| a. | To include item descriptions and vendor part numbers, leave the Show Description and Show Detail check boxes selected. For item totals only, clear the check boxes. |
| b. | Select a sorting method from the Sort Detail drop-down. |
| c. | To display the sort detail from highest to lowest, select the Descending check box. Otherwise, leave the check box clear. |
| 8. | Click Print. The Report Window opens. |
| 9. | Print the report and close the Report Window. |
| 10. | Close the Sale Comparison Report screen. |
With the Sales Information Report, you can identify which items were popular sellers during a specific date range and which customers affect sales and profits the most. You can also use this report to gauge mechanic productivity.
Which brand of tires is the most or least profitable
Which tire of a particular size is sold the most or least
Which customer spent the most or least money
Which customer type contributes the most or least to your gross profit
Which services (labor) are sold the most or least
Which services (labor) did a mechanic perform the most
To generate a Sales Information Report
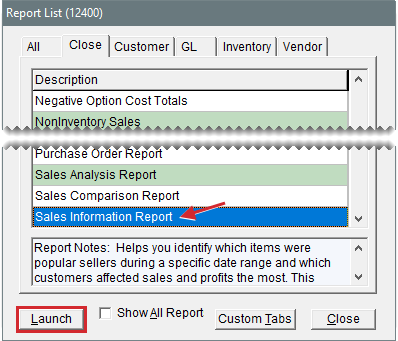
| 1. | Select Closing > Reports. The Report List opens with the Close tab selected. |
| 2. | Select Sales Information Report and click Launch. The Sales Information Report screen opens. |
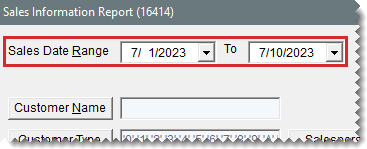
| 3. | Select starting and ending dates from the Sales Date Range pop-up calendars. |
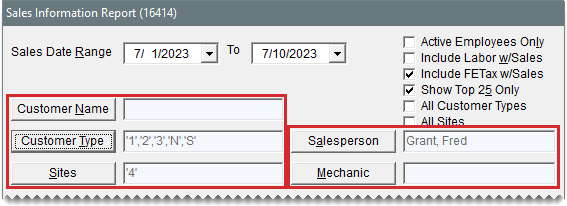
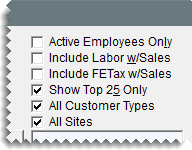
| 4. | Select the following check boxes as needed: |
Active Employees Only to limit the report to active employees
Include Labor w/Sales to retrieve sales information for labor items
Include FETax w/Sales to retrieve federal excise tax assessed for items (Available in TireMaster 9.4.0.)
Show Top 25 Only to limit information to the 25 most popular items
All Customer Types to retrieve information for all customer types (Available in TireMaster 9.4.0.)
All Sites to retrieve information for all sites (Available in TireMaster 9.4.0.)
| 5. | Define which customer or employee information to include on the report by doing one of the following: |
For all customers, leave the Customer Name, Customer Type, and Salesperson fields blank.
For a single customer, click Customer Name and look up the customer. For more information, see Customer Searches.
For one or more customer types, click Customer Type. Then select one or more types from the list that opens.
For information about customers assigned to a specific salesperson, click Salesperson and select a name from the list that opens.
For information from specific sites, click Sites. Then select one or more sites from the list that opens (multi-store environments only).
For information about mechanic productivity, click Mechanic and select a name from the list that opens.
| 6. | Define which items you want to include on the report by doing one of the following: |
For a single item or a group of items, click Inventory and look up the item or items. For more information, see Inventory Searches.
For all items, leave the Inventory field blank.
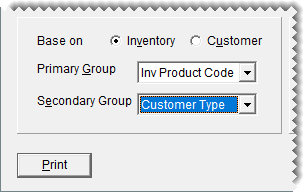
| 7. | To organize the items retrieved by the report, do the following: |
| a. | Define how to list the items by selecting Inventory or Customer. |
| b. | Select the main method of grouping the items from the Primary Group drop-down. |
| c. | Select an additional grouping method from the Secondary Group drop‑down, if needed. |
| 8. | To display both invoice detail and totals on the report, do the following. |
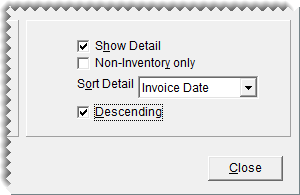
| a. | Select the Show Detail check box. |
| b. | To limit the report to noninventoriable items, select the Non-Inventory only check box. |
| c. | Select a sorting method from the Sort Detail drop-down. |
| d. | To display the sort detail from highest to lowest, select the Descending check box. Otherwise, leave the check box clear. |
| 9. | To limit report output to the site from which you're running the report, select the Local Site Only checkbox (Data Exchange environments only). |
| 10. | Click Print. The Report Window opens. |
| 11. | Print the report and close the Report Window. |
This report provides a summary of the following information for each sales‑tax rate:
Taxable sales total
Nontaxable sales total
Tax collected
Labor sales total
Taxable sales and nontaxable sales total
To generate a Sales Tax by Rate Report
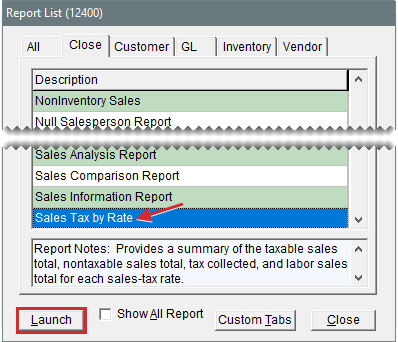
| 1. | Select Closing > Reports. The Report List opens with the Close tab selected. |
| 2. | Select Sales Tax by Rate and click Launch. The Date Range screen opens. |
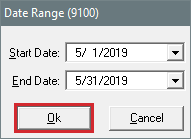
| 3. | Select the starting and ending dates for the report’s date range. |
| 4. | Click OK. The Report Window opens. |
| 5. | Print the report and close the Report Window. |
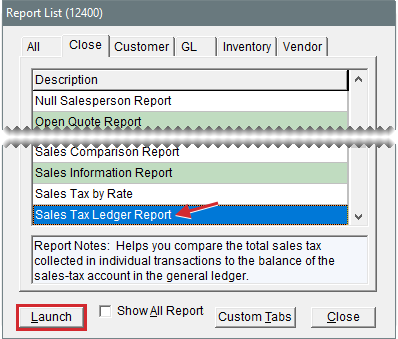
With the Sales Tax Ledger Report, you can compare the total sales tax collected in individual transactions to the balance of the general ledger’s sales tax account. This report also displays the GL codes associated with the general ledger’s income accounts.
To generate a Sales Tax Ledger Report
| 1. | Select Closing > Reports. The Report List opens with the Close tab selected. |
| 2. | Select Sales Tax Ledger Report and click Launch. The Sales Tax Ledger Report screen opens. |
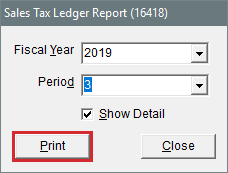
| 3. | Select a fiscal year and period from the drop-downs. |
| 4. | To include invoice information on the report, make sure the Detail check box is selected. For account totals only, clear the Detail check box. |
| 5. | Click Print. The Report Window opens. |
| 6. | Print the report and close the Report Window. |
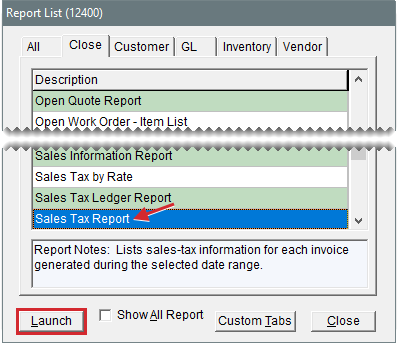
This report lists sales tax information for each invoice generated during the selected date range.
To generate a Sales Tax Report
| 1. | Select Closing > Reports. The Report List opens with the Close tab selected. |
| 2. | Select Sales Tax Report and click Launch. The Date Range screen opens. |
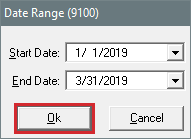
| 3. | Select the starting and ending dates for the report’s date range. |
| 4. | Click OK. The Report Window opens. |
| 5. | Print the report and close the Report Window. |
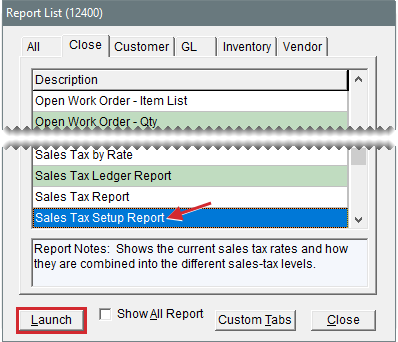
This report shows how your sales tax rates are combined into the different sales tax levels.
To generate a Sales Tax Setup Report
| 1. | Select Closing > Reports. The Report List opens with the Close tab selected. |
| 2. | Select Sales Tax Setup Report and click Launch. The Report Window opens. |
| 3. | Print the report and close the Report Window. |
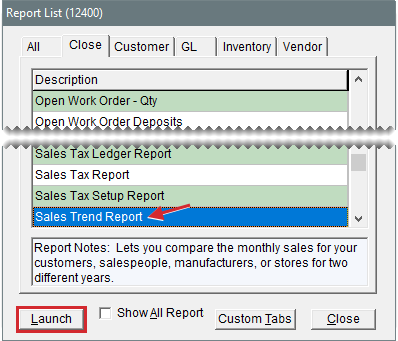
This report lets you compare the monthly sales for two different years. You can display trend information as numbers or as a bar graph, and group it by customer, salesperson, or manufacturer if needed.
To generate a Sales Trend Report
| 1. | Select Closing > Reports. The Report List opens with the Close tab selected. |
| 2. | Select Sales Trend Report and click Launch. The Sales Trend Report Options screen opens. |
| 3. | Select one of the following report types: |
Store to generate a report of storewide sales trends
Salesperson to generate report of sales trends by salesperson
| 4. | Select one of the following methods for organizing items on the report: |
Category
Group
Neither
| 5. | Select one of the following in the Display area: |
Units to display the number of units sold
Dollars to display the dollar amount generated
| 6. | Select one of the following in the Report area: |
Detail to generate a report showing units sold or dollar amounts as numbers
Graph to generate a bar graph that represents units sold or dollar amounts
| 7. | If you want to group trend information by customer, salesperson, or manufacturer, select Customer, Salesperson, or Manufacturer in the Selection area. Otherwise, go to step 9. |
| 8. | Depending on your selection in step 7, look up one of the following: |
For a single customer, manufacturer, or salesperson, click the Selected Customer field, Beginning Salesperson field, or Beginning Manufacturer field and press  . TireMaster prompts you to type a customer’s name or select a salesperson or manufacturer from a list.
For a range of customers or manufacturers, click the Beginning Salesperson field or Beginning Manufacturer field, press  , and select a salesperson or manufacturer from the list that opens. Repeat this process for the Ending Salesperson or Ending Manufacturer fields.
For all customers, salespeople, or manufacturers, leave the fields blank.
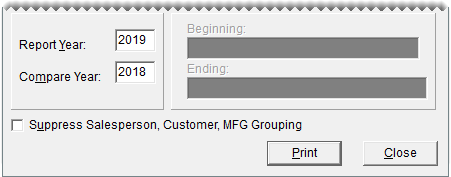
| 9. | Type the two years you want to compare in the Report Year and Compare Year fields. |
| 10. | If you want to disable the grouping of trend information by customer, salesperson, or manufacturer, select the Suppress Salesperson, Customer, MFG Grouping check box. |
| 11. | Click Print. The Report Window opens. |
| 12. | Print the report and close the Report Window. |
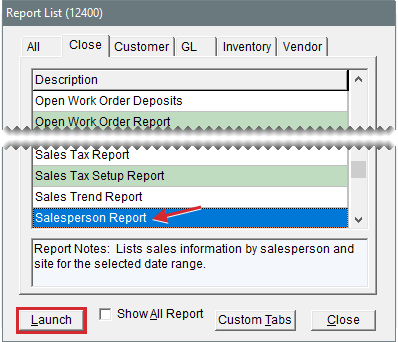
This report lists sales totals by salesperson for the selected date range.
To generate a salesperson report
| 1. | Select Closing > Reports. The Report List opens with the Close tab selected. |
| 2. | Select Salesperson Report and click Launch. The Report Options screen opens. |
| 3. | Select starting and ending dates for the report’s date range. |
| 4. | Select one of the following methods for organizing items on the report: |
Category
Group
| 5. | To include information about each item sold, make sure the Show All Details check box is selected. For category or group subtotals, clear the check box. |
| 6. | Do one of the following in the Employee Range area: |
For all users, leave the From and To fields blank.
For a range of users, select the employees for the beginning (From field) and end (To field) of the range. To select an employee, click a field and press  . Then choose a name from the list that opens.
For a single user, click the From field and press  . Then choose a name from the list that opens.
| 7. | Click OK. The Report Window opens. |
| 8. | Click Print. Then close the Report Window. |
This report lists all customers and vendors who’ve been sent text messages or documents by email from TireMaster during the selected date range.
For emails, the report lists the email address and the type of document sent to it. If the same document is listed multiple times, it was emailed more than once or both the original document and one or more duplicate copies were sent.
For text messages, the report lists a the type of text message that was sent. If the same type of text message is listed multiple times, it was sent more than once.
To generate a Sent Email/Text List
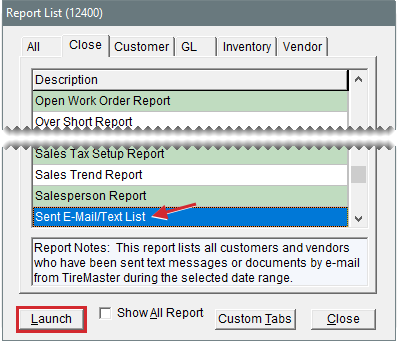
| 1. | Select Closing > Reports. The Report List opens with the Close tab selected. |
| 2. | Select Sent Email List and click Launch. The Sent Email Report List screen opens. |
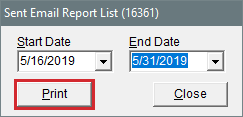
| 3. | Select a date or date range for the report, and click Print. The Report Window opens. |
| 4. | Print the report and close the Report Window. |
This report provides a detailed listing of the inspection area settings for each of your service checklists. For each inspection area, the report includes a description of what to check and a list of items that can be sold to customers when services are recommended. The report also identifies which postcard code, if any, is assigned to an inspection area and whether services are recommended based on vehicle mileage.
To generate a Service Checklist Setup Report
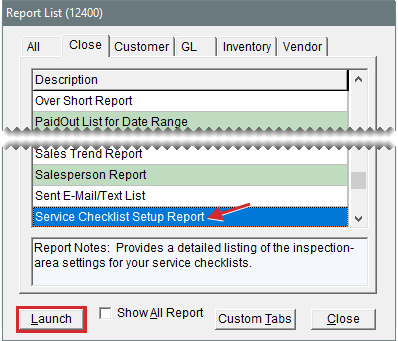
| 1. | Select Closing > Reports. The Report List opens with the Close tab selected. |
| 2. | Select Service Checklist Setup Report and click Launch. The Report Window opens. |
| 3. | Print the report and close the Report Window. |
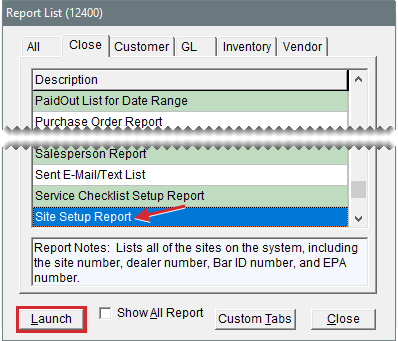
This report lists all of your sites and includes information such as site number, dealer number, Bar ID number, and EPA number.
To generate the Site Setup Report
| 1. | Select Closing > Reports. The Report List opens with the Close tab selected. |
| 2. | Select Site Setup Report and click Launch. The Report Window opens. |
| 3. | Print the report and close the Report Window. |
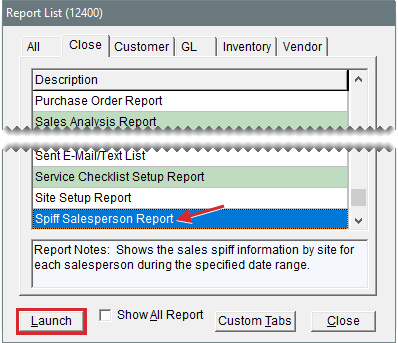
This report shows the sales spiff information for each salesperson during the specified date range. For each spiff item that’s sold, this report shows the quantity sold, the parts total, and the resulting spiff amount. It also shows the spiff percentage and spiff amount to remind you of the settings for a particular spiff.
To generate a spiff salesperson report
| 1. | Select Closing > Reports. The Report List opens with the Close tab selected. |
| 2. | Select Spiff Salesperson Report and click Launch. The Date Range screen opens. |
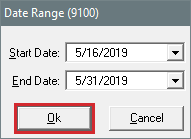
| 3. | Select the starting and ending dates for the report’s date range. |
| 4. | Click OK. The Report Window opens. |
| 5. | Print the report and close the Report Window. |
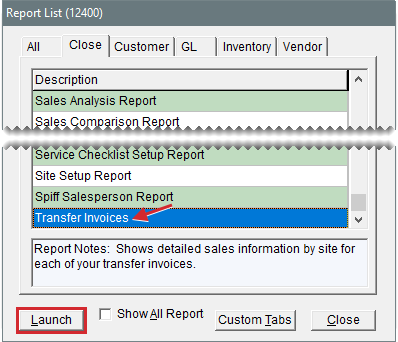
This report shows detailed sales information for each of your transfer invoices.
To generate a report of transfer invoices
| 1. | Select Closing > Reports. The Report List opens with the Close tab selected. |
| 2. | Select Transfer Invoices and click Launch. The Date Range screen opens. |
| 3. | Select the starting and ending dates for the report’s date range. |
| 4. | Click OK. The Report Window opens. |
| 5. | Print the report and close the Report Window. |
