Inventory Tab Reports
This help topic is applicable to the following TireMaster applications:
|
TireMaster Point of Sale |
TireMaster Plus |
TireMaster Corporate |
|---|---|---|

|

|

|
These reports are useful for managing your inventory.
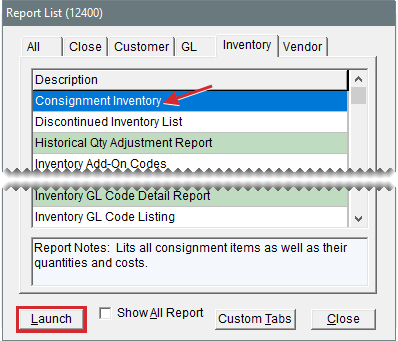
This report lists all consignment items (items assigned type C) as well as their quantities and costs.
To generate a Consignment Inventory Report
| 1. | Select Inventory > Reports. The Report List opens with the Inventory tab selected. |
| 2. | Select Consignment Inventory and click Launch. The Custom Inventory Lookup screen opens. |
| 3. | Look up one or more items. The Report Window opens. For more information, see Inventory Searches. |
| 4. | Print the report and close the Report Window. |
This report lists all items marked as discontinued on the Inventory Maintenance Screen. Information displayed on the report includes the on hand quantity, unpriced quantity, total quantity, parts price, labor price, and FET.
To generate a Discontinued Inventory List
| 1. | Select Inventory > Reports. The Report List opens with the Inventory tab selected. |
| 2. | Select Discontinued Inventory List and click Launch. The Report Window opens. |
| 3. | Print the report and close the Report Window. |
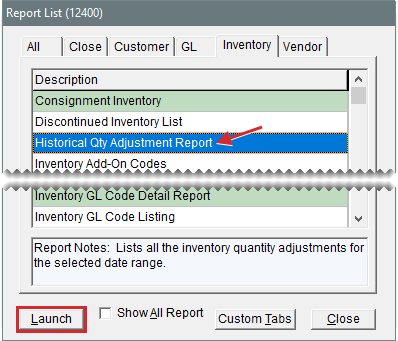
This report lists all the inventory quantity adjustments for the selected date range.
To generate a Historical Qty Adjustment Report
| 1. | Select Inventory > Reports. The Report List opens with the Inventory tab selected. |
| 2. | Select Historical Qty Adjustment Report and click Launch. The Report Option screen opens. |
| 3. | Select the starting and ending dates for the report’s date range. |
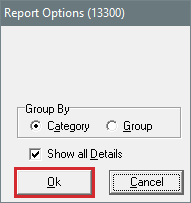
| 4. | Select one of the following methods for organizing items on the report: |
Category
Group
| 5. | To include individual items, make sure the Show All Details check box is selected. For group or category totals only, clear the check box. |
| 6. | Click OK. The Report Window opens. |
| 7. | Print the report and close the Report Window. |
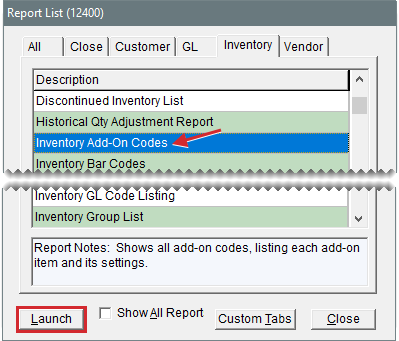
This report shows all add-on codes, along with the settings and items assigned to each of the codes.
To generate an Inventory Add-On Codes Report
| 1. | Select Inventory > Reports. The Report List opens with the Inventory tab selected. |
| 2. | Select Inventory Add-On Codes and click Launch. The Report Window opens. |
| 3. | Print the report and close the Report Window. |
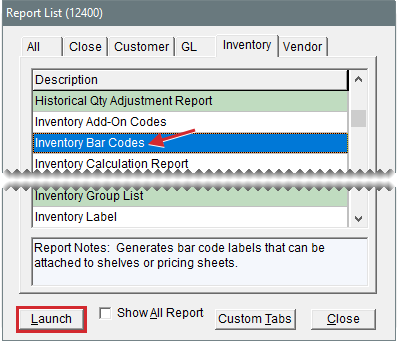
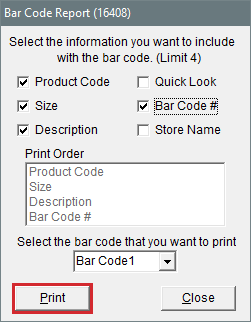
With this report, you can generate bar code labels that can be attached to shelves or pricing sheets. In addition to bar codes, the labels can include up to four types of information, such as sizes and descriptions. Bar codes can be printed on Avery® 8163 label sheets or other compatible label sheets (2 x 4 inches).
To generate inventory bar codes
| 1. | Load the printer with label sheets. |
| 2. | Select Inventory > Reports. The Report List opens with the Inventory tab selected. |
| 3. | Select Inventory Bar Codes and click Launch. The Bar Code Report screen opens. |
| 4. | Select up to four of the following types of information to include with the bar code: |
Product Code
Size
Description
Quick Look
Bar Code #
Store Name
| 5. | Select the bar code that you want to print from the drop-down. |
| 6. | Click Print. The Custom Inventory Lookup screen opens. |
| 7. | Look up the items whose bar codes you want to print. The Report Window opens. For more information, see Inventory Searches. |
| 8. | Print the labels and close the Report Window. |
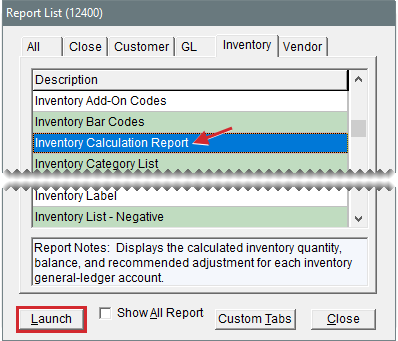
This report displays the following information for each of the general ledger’s inventory accounts:
The calculated inventory quantity
The general ledger account’s current balance
The recommended adjustment
You can launch this report from the Report List, and it is automatically generated when you select Closing > Inventory Calc & Post from the menu.
The Inventory Calculation Report is available only
To generate an Inventory Calculation Report
| 1. | Select Inventory > Reports. The Report List opens with the Inventory tab selected. |
| 2. | Select Inventory Calculation Report and click Launch. TireMaster prompts you to show report detail. |
| 3. | To include information for individual items, click Yes. For account totals only, click No. The Report Window opens. |
| 4. | Print the report and close the Report Window. |
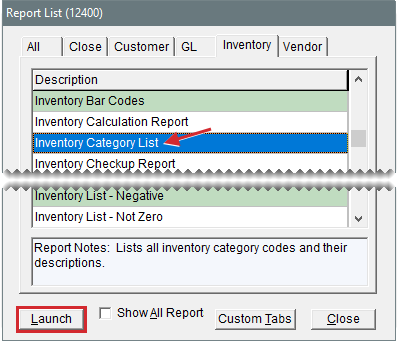
This report lists all inventory category codes and their descriptions.
To generate an Inventory Category List
| 1. | Select Inventory > Reports. The Report List opens with the Inventory tab selected. |
| 2. | Select Inventory Category List and click Launch. The Report Window opens. |
| 3. | Print the report and close the Report Window. |
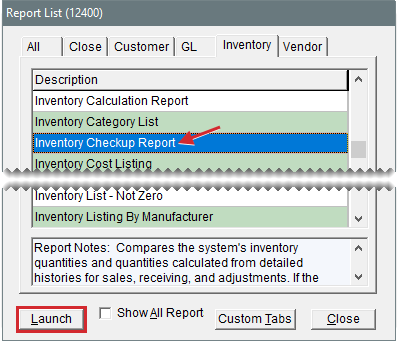
This report compares TireMaster’s inventory quantities to the quantities calculated from detailed histories for sales, receivings, and adjustments. If the report notes any differences, call ASA Support. Print this report at stores only.
To generate an Inventory Check Up Report
| 1. | Select Inventory > Reports. The Report List opens with the Inventory tab selected. |
| 2. | Select Inventory Check Up Report and click Launch. The Report Window opens. |
| 3. | Print the report and close the Report Window. |
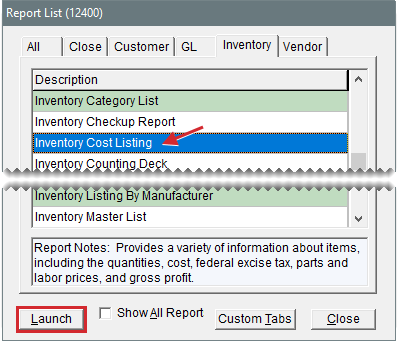
This report provides a variety of information about items, including quantities, cost, federal excise tax, parts and labor prices, and gross profits. With this report, you can also view month-to-date, year-to-date, and last year’s total quantities sold for items.
To generate an Inventory Cost Listing
| 1. | Select Inventory > Reports. The Report List opens with the Inventory tab selected. |
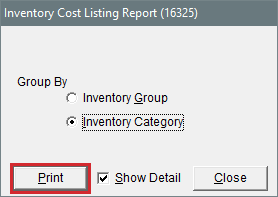
| 2. | Select Inventory Cost Listing and click Launch. The Inventory Cost Listing Report screen opens. |
| 3. | Click Lookup and select the site or sites whose information you want to include on the report |
| 4. | Select one of the following methods for organizing items on the report: |
Inventory Group
Inventory Category
Site
| 5. | To include information for individual items, make sure the Show Detail check box is selected. For totals only, clear the check box. |
| 6. | Click Print. The Custom Inventory Lookup screen opens. |
| 7. | Look up the items you want to include on the report. The Report Window opens. For more information, see Inventory Searches. |
| 8. | Print the report and close the Report Window. |
| 9. | Close the Inventory Cost Listing Report screen. |
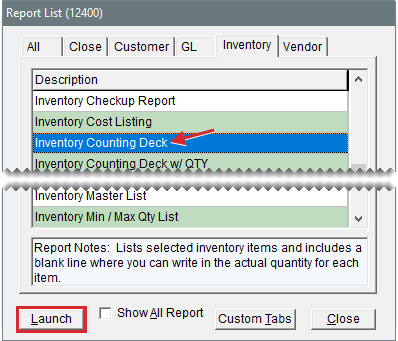
This report lists the items you want to count, and it includes blank lines where you can write the actual quantity for each of the items.
To generate an Inventory Counting Deck
| 1. | Select Inventory > Reports. The Report List opens with the Inventory tab selected. |
| 2. | Select Inventory Counting Deck and click Launch. The Custom Inventory Lookup screen opens. |
| 3. | Look up the items you want to count. The Report Window opens. For more information, see Inventory Searches. |
| 4. | Print the report and close the Report Window. |
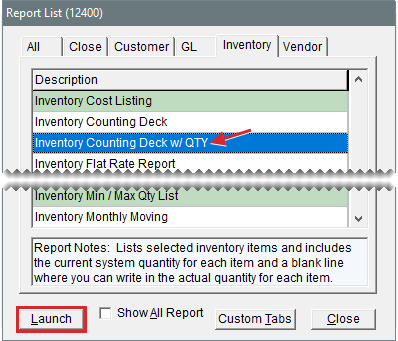
This report lists the items that you want to count. For each item, it includes the current system‑generated quantity, a blank line where you can write the actual quantity, and the quantity on work orders.
To generate an Inventory Counting Deck w/QTY
| 1. | Select Inventory > Reports. The Report List opens with the Inventory tab selected. |
| 2. | Select Inventory Counting Deck w/ QTY and click Launch. The Custom Inventory Lookup screen opens. |
| 3. | Look up the items you want to count. The Report Window opens. For more information, see Inventory Searches. |
| 4. | Print the report and close the Report Window. |
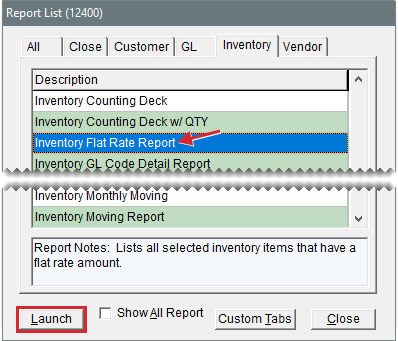
This report lists items whose settings include a flat rate. For more information, see Flat Rate Reporting.
To generate an Inventory Flat Rate Report
| 1. | Select Inventory > Reports. The Report List opens with the Inventory tab selected. |
| 2. | Select Inventory Flat Rate Report and click Launch. The Custom Inventory Lookup screen opens. |
| 3. | Look up the items you whose flat rate you want to see. The Report Window opens. For more information, see Inventory Searches. |
| 4. | Print the report and close the Report Window. |
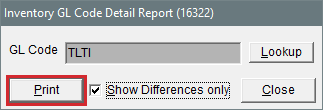
This report lists the items that GL codes are assigned to, along with category, group, quantity, and cost information. It can be generated for a single GL code or all GL codes. You can also limit the report to specific items, items with differing last costs and next costs, or both.
To generate an Inventory GL Code Detail Report
| 1. | Select Inventory > Reports. The Report List opens with the Inventory tab selected. |
| 2. | Select Inventory GL Code Detail Report and click Launch. The Inventory GL Code Detail Report screen opens. |
| 3. | Select one or more GL codes: |
For one code, click Lookup and select a code from the list that opens.
For all codes, leave the GL Code field blank.
| 4. | To display only those items whose last and next costs differ, select the Show Differences Only check box. For all items, leave the check box clear. |
| 5. | Click Print. The Custom Inventory Lookup screen opens. |
| 6. | Look up the items you want to include on the report. The Report Window opens. For more information, see Inventory Searches. |
| 7. | Print the report and close the Report Window. |
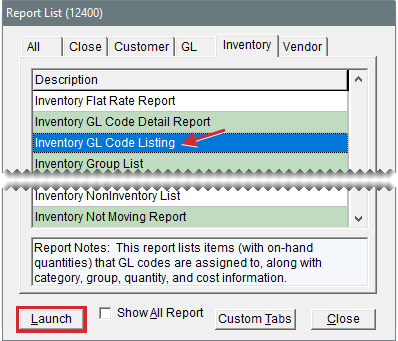
This report lists each inventory GL code as well as its description, inventoriable status, department, and each of the general ledger accounts assigned to it. The Inventory GL Code Listing is available only
To generate an Inventory GL Code Listing
| 1. | Select Inventory > Reports. The Report List opens with the Inventory tab selected. |
| 2. | Select Inventory GL Code Listing and click Launch. The Report Window opens. |
| 3. | Print the report and close the Report Window. |
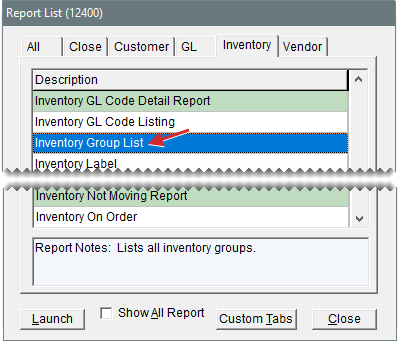
This report lists the inventory groups set up in TireMaster.
To generate an Inventory Group List
| 1. | Select Inventory > Reports. The Report List opens with the Inventory tab selected. |
| 2. | Click Inventory Group List and click Launch. The Report Window opens and displays the report. |
| 3. | Print the report and close the Report Window. |
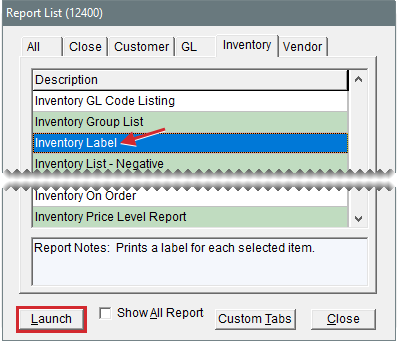
This report prints a label for each selected item. Each page of the report prints three labels across and ten labels down. The labels include the following information:
Product Code
Manufacturer
Name (Description)
Size
Rim Size
Vendor Part Number
Everyday Low Price
To create inventory labels
| 1. | Load the reports printer with label sheets. |
| 2. | Select Inventory > Reports. The Report List opens with the Inventory tab selected. |
| 3. | Select Inventory Labels and click Launch. The Custom Inventory Lookup screen opens. |
| 4. | Look up the items for which you’re creating labels. The Report Window opens. For more information, see Inventory Searches. |
| 5. | Print the report and close the Report Window. |
This report lists inventory items that have negative quantities in TireMaster.
To generate an Inventory List - Negative Report
| 1. | Select Inventory > Reports. The Report List opens with the Inventory tab selected. |
| 2. | Select Inventory List - Negative and click Launch. The Custom Inventory Lookup screen opens. |
| 3. | Look up the items you want to include on the report. The Report Window opens. For more information, see Inventory Searches. |
| 4. | Print the report and close the Report Window. |
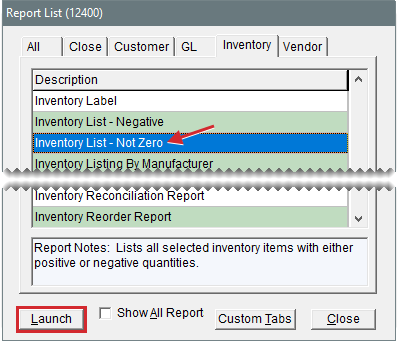
This report lists all selected items with either positive or negative quantities.
To generate an Inventory List - Not Zero Report
| 1. | Select Inventory > Reports. The Report List opens with the Inventory tab selected. |
| 2. | Select Inventory List - Not Zero and click Launch. The Custom Inventory Lookup screen opens. |
| 3. | Look up the items you want to check. The Report Window opens. For more information, see Inventory Searches. |
| 4. | Print the report and close the Report Window. |
This report lists items by manufacturer with costs for on hand and unpriced items.
To generate an Inventory Listing by Manufacturer
| 1. | Select Inventory > Reports. The Report List opens with the Inventory tab selected. |
| 2. | Select Inventory Listing By Manufacturer and click Launch. The Custom Inventory Lookup screen opens. |
| 3. | Look up items for one or more manufacturers. The Report Window opens. For more information, see Search by Manufacturer. |
| 4. | Print the report and close the Report Window. |
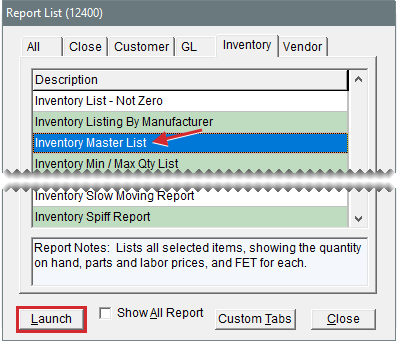
This report lists all selected items, showing the quantity on hand, parts and labor prices, and FET for each. This report includes both inventoriable and noninventoriable items.
To generate an Inventory Master List
| 1. | Select Inventory > Reports. The Report List opens with the Inventory tab selected. |
| 2. | Select Inventory Master List and click Launch. The Custom Inventory Lookup screen opens. |
| 3. | Look up the items you want to include on the report. The Report Window opens. For more information, see Inventory Searches. |
| 4. | Print the report and close the Report Window. |
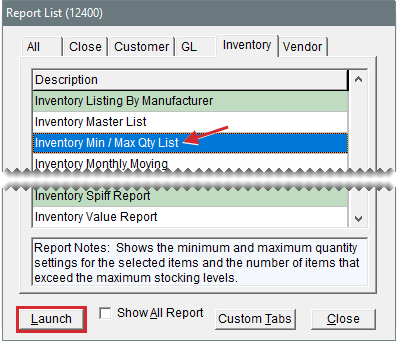
This report shows the minimum and maximum quantity settings for the selected items and the number of items that exceed the maximum stocking levels. In addition to stocking level information, the report also includes on work order, on hand, unpriced quantities.
To generate an Inventory Min/Max Qty List
| 1. | Select Inventory > Reports. The Report List opens with the Inventory tab selected. |
| 2. | Select Inventory Min/Max Qty List and click Launch. The Custom Inventory Lookup screen opens. |
| 3. | Look up the items you want to check. The Report Window opens. For more information, see Inventory Searches. |
| 4. | Print the report and close the Report Window. |
This report lists inventory items, as well as the quantities that have been received and sold, during the last 30 days.
To generate an inventory monthly moving report
| 1. | Select Inventory > Reports. The Report List opens with the Inventory tab selected. |
| 2. | Select Inventory Monthly Moving and click Launch. The Custom Inventory Lookup screen opens. |
| 3. | Look up the items you want to include on the report. The Report Window opens. For more information, see Inventory Searches. |
| 4. | Print the report and close the Report Window. |
This report lists the quantities on hand and the quantities sold each month, during a user-defined date range.
To generate an Inventory Moving Report
| 1. | Select Inventory > Reports. The Report List opens with the Inventory tab selected. |
| 2. | Select Inventory Moving Report and click Launch. The Inventory Moving Report screen opens. |
| 3. | Type the beginning and ending dates of the date range. For a single day, use the same day for the beginning and ending date. |
| 4. | Select one of the following methods for organizing items on the report: |
Product Code
Size
Description
Category
Group
MFG
| 5. | To include minimum/maximum quantities, location (where the item is stored), and site, select one or more of the check boxes. |
| 6. | Click Print. The Custom Inventory Lookup screen opens. |
| 7. | Look up the items you want to include on the report. The Report Window opens. For more information, see Inventory Searches. |
| 8. | Select the site or sites whose information you want to include on the report, and click OK |
| 9. | Print the report and close the Report Window. |
This report lists selected noninventory items, including the quantity on hand, parts and labor prices, and FET for each.
To generate an Inventory NonInventory List
| 1. | Select Inventory > Reports. The Report List opens with the Inventory tab selected. |
| 2. | Select Inventory NonInventory List and click Launch. The Custom Inventory Lookup screen opens. |
| 3. | Look up the items you want to include you want to include on the report. The Report Window opens. For more information, see Inventory Searches. |
| 4. | Print the report and close the Report Window. |
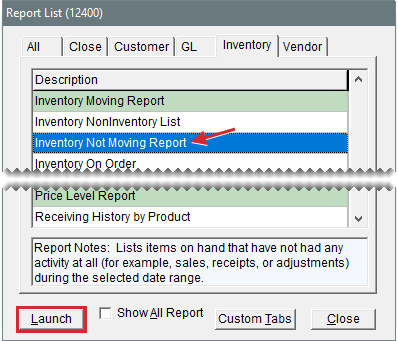
For items you currently have on hand, this report shows those that have not had any activity at all (for example, sales, receipts, or adjustments) during the selected date range.
To generate an Inventory Not Moving Report
| 1. | Select Inventory > Reports. The Report List opens with the Inventory tab selected. |
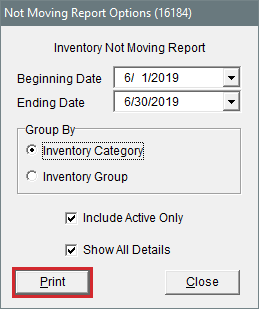
| 2. | Select Inventory Not Moving Report and click Launch. The Not Moving Report Options screen opens. |
| 3. | Select the starting and ending dates for the report’s date range. |
| 4. | Select one of the following methods for organizing items on the report: |
Inventory Group
Inventory Category
| 5. | To exclude inactive items, make sure the Include Active Only check box is selected. For both active and inactive items, clear the check box. |
| 6. | To include information for individual items, make sure the Show All Details check box is selected. For group or category totals only, clear the check box. |
| 7. | Click Print. |
| 8. | Print the report and close the Report Window. |
This report provides information about items that have been ordered. For each item, the report displays the vendor, date ordered, prices, and quantity ordered and received.
To generate an Inventory On Order Report
| 1. | Select Inventory > Reports. The Report List opens with the Inventory tab selected. |
| 2. | Select Inventory On Order and click Launch. The Inventory On Order screen opens. |
| 3. | Click Lookup, and select the site or sites for which you want to include information on the report |
| 4. | To include purchase order information on the report, make sure the Show Detail check box is selected. To display ordered items only, clear the check box. |
| 5. | Click Print. The Custom Inventory Lookup screen opens. |
| 6. | Look up the items you want to include on the report. The Report Window opens. For more information, see Inventory Searches. |
| 7. | Print the report and close the Report Window. |
| 8. | Close the Inventory On Order screen. |
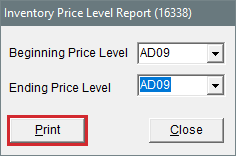
This report lists each price level in a selected range, the four-digit code and description for each price level, and all of the corresponding price level discounts.
To generate an Inventory Price Level Report
| 1. | Select Inventory > Reports. The Report List opens with the Inventory tab selected. |
| 2. | Select Inventory Price Level Report and click Launch. The Report Options screen opens. |
| 3. | Select one price level or a range of price levels: |
For one price level, click  next to the Beginning Price Level field and select a price level from the list. Then repeat this process for the Ending Price Level field.
For a range of price levels, click  next to the Beginning Price Level field and select the price level for the beginning of the range. Then click
  next to the Ending Price Level field and select the price level for the end of the range.
| 4. | Click Print. The Report Window opens. |
| 5. | Print the report and close the Report Window. |
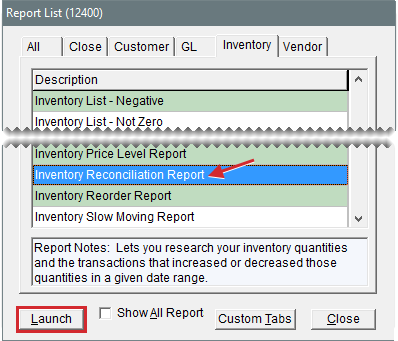
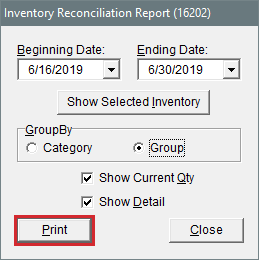
With the Inventory Reconciliation Report, you can research your inventory quantities and the transactions that increased or decreased those quantities in a given date range. Because this report displays the ending quantities and costs of items for the specified date range, you might want to include printing it in your month end closing procedures.
To generate an Inventory Reconciliation Report
| 1. | Select Inventory > Reports. The Report List opens with the Inventory tab selected. |
| 2. | Select Inventory Reconciliation Report and click Launch. The Custom Inventory Lookup screen opens. |
| 3. | Look up the items you want to include on the report. The Selected Inventory screen opens. For more information, see Inventory Searches. |
| 4. | Click OK. The Inventory Reconciliation Report screen opens. |
| 5. | Select the starting and ending dates for the report’s date range. |
| 6. | Select one of the following methods for organizing items on the report: |
Category
Group
| 7. | Select or clear the following check boxes as needed: |
Show Detail includes document numbers, unit costs, and part numbers on the report.
Show Current Qty includes current on hand and current work order quantities.
| 8. | Click Print. The Report Window opens. |
| 9. | Print the report and close the Report Window. |
| 10. | Close the Inventory Reconciliation Report screen. |
This report lists on hand quantities for all items in the selected range. It also includes the total weight and month-to-date, year-to-date, and last year’s quantities sold for each of the items. Unlike the reorder report generated by the suggested purchase order feature, this one is not based on minimum stocking levels.
To generate an Inventory Reorder Report
| 1. | Select Inventory > Reports. The Report List opens with the Inventory tab selected. |
| 2. | Select Inventory Reorder Report and click Launch. The Custom Inventory Lookup screen opens. |
| 3. | Look up the items that you want to include on the report. The Report Window opens. For more information, see Inventory Searches. |
| 4. | Print the report and close the Report Window. |
This report shows items for which the following is true:
They have an on hand quantity of any number except zero.
They have not been sold during the specified date range.
This report also provides the dates on which the items were last sold.
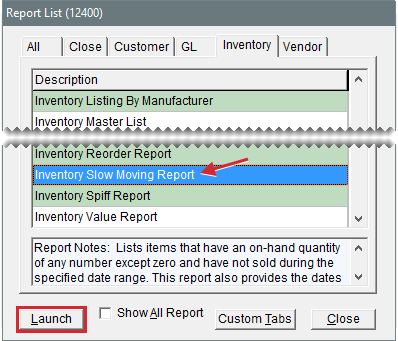
To generate an Inventory Slow Moving Report
| 1. | Select Inventory > Reports. The Report List opens with the Inventory tab selected. |
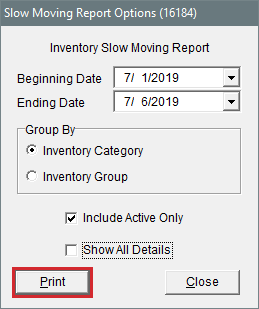
| 2. | Select Inventory Slow Moving Report and click Launch. The Report Options screen opens. |
| 3. | Select the starting and ending dates for the report’s date range. |
| 4. | Select one of the following methods for organizing items on the report: |
Inventory Group
Inventory Category
| 5. | To exclude inactive items, make sure the Include Active Only check box is selected. For both active and inactive items, clear the check box. |
| 6. | If you want to include individual items on the report, make sure the Show All Details check box is checked. For category or group totals only, clear the check box. |
| 7. | Click Print. The Report Window opens. |
| 8. | Print the report and close the Report Window. |
This report lists each sales spiff, its associated color, and its settings. The report also lists all the items associated with a spiff, the calculated spiff commission, and the parts price that’s used in the calculation.
To generate an Inventory Spiff Report
| 1. | Select Inventory > Reports. The Report List opens with the Inventory tab selected. |
| 2. | Select Inventory Spiff Report and click Launch. The Custom Inventory Lookup screen opens. |
| 3. | Look up the items you want to include on the report. The Report Window opens. For more information, see Inventory Searches. |
| 4. | Print the report and close the Report Window. |
This report lists the value of inventory items sorted by category or group. The value is the quantity on hand multiplied by the item’s cost (usually the next cost) including any FET.
To generate an Inventory Value Report
| 1. | Select Inventory > Reports. The Report List opens with the Inventory tab selected. |
| 2. | Select Inventory Value Report and click Launch. The Report Options screen opens. |
| 3. | Select one of the following methods for organizing items on the report: |
Category
Group
| 4. | To include information for individual items, make sure the Show All Details check box is selected. For group or category totals only, clear the check box. |
| 5. | Click OK. The Report Window opens. |
| 6. | Print the report and close the Report Window. |
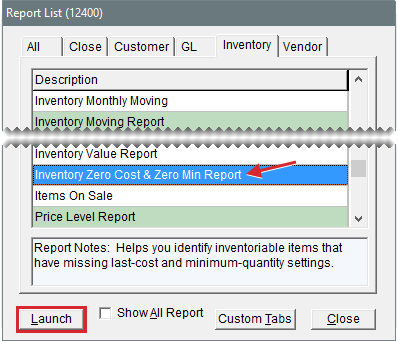
This report helps you identify items that have incomplete settings. The report displays only inventoriable items whose settings are missing the last cost and minimum quantity.
To generate an Inventory Zero Cost & Zero Min Report
| 1. | Select Inventory > Reports. The Report List opens with the Inventory tab selected. |
| 2. | Select Inventory Zero Cost & Zero Min Report and click Launch. The Custom Inventory Lookup screen opens. |
| 3. | Look up the items you want to check. The Report Window opens. For more information, see Inventory Searches. |
| 4. | Print the report and close the Report Window. |
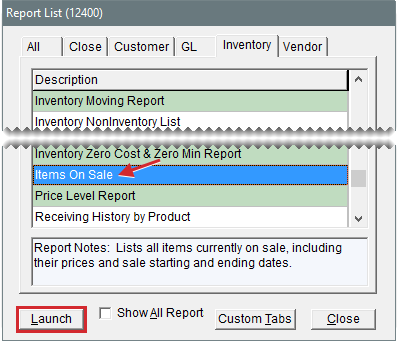
This report lists all items currently on sale, including their prices and sale starting and ending dates.
To generate an Items on Sale Report
| 1. | Select Inventory > Reports. The Report List opens with the Inventory tab selected. |
| 2. | Select Items on Sale and click Launch. The Report Window opens. |
| 3. | Print the report and close the Report Window. |
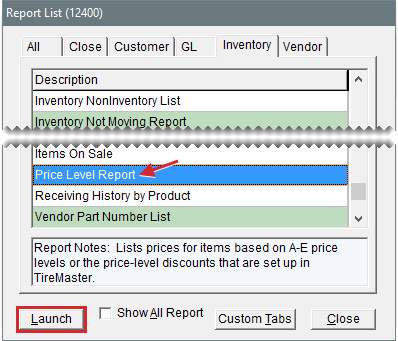
Lists prices for items based on A–E price levels or the price level discounts that are set up in TireMaster.
To generate a Price Level Report
| 1. | Select Inventory > Reports. The Report List opens with the Inventory tab selected. |
| 2. | Select Price Level Report and click Launch. The Price Level Report screen opens. |
| 3. | Do one of the following: |
For a list of items that are assigned A–E price levels, select one or more of the check boxes labeled A, B, C, D, and E.
For a list of items that are assigned price level discounts, click Lookup and select one or more price level discounts.
| 4. | Select one of the following methods for organizing items on the report: |
None
Inventory Group
Inventory Category
Manufacturer
| 5. | Click Print. The Custom Inventory Lookup screen opens. |
| 6. | Look up the items that you want to include on the report. The Report Window opens. For more information, see Inventory Searches. |
| 7. | Print the report and close the Report Window. |
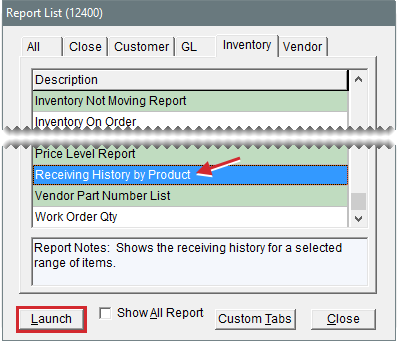
This report shows the receiving history for a selected range of items.
To generate a Receiving History by Product
| 1. | Select Inventory > Reports. The Report List opens with the Inventory tab selected. |
| 2. | Select Receiving History by Product Report and click Launch. The Custom Inventory Lookup screen opens. |
| 3. | Look up the items you want to include on the report. The Report Window opens. For more information, see Inventory Searches. |
| 4. | Print the report and close the Report Window. |
This report shows the vendor part numbers assigned to a selected group of items, along with the corresponding reconciliation codes for each of the vendor part numbers.
To generate a vendor part number list
| 1. | Select Inventory > Reports. The Report List opens with the Inventory tab selected. |
| 2. | Select Vendor Part Number List and click Launch. The Report Window opens. |
| 3. | Print the report and close the Report Window. |
This report lists the quantities of all items that are currently on open work orders.
To generate a Work Order Qty Report
| 1. | Select Inventory > Reports. The Report List opens with the Inventory tab selected. |
| 2. | Select Work Order Qty and click Launch. The Report Window opens. |
| 3. | Print the report and close the Report Window. |

